
Techno-economic Realities of Long-Distance Hydrogen Transport
A Cost Analysis of Importing Low-Carbon Hydrogen to Europe
About this report
Many governments have recognized the need for more low-emissions hydrogen and have announced plans to rapidly scale production and imports. The EU has announced aggressive targets, planning to produce 10 million tonnes per annum (TPA) of hydrogen domestically and import 10 million TPA of renewable hydrogen by 2030. In the U.S., the Department of Energy aims to increase low-emissions hydrogen production from nearly zero today to 10 million TPA by 2030.
This report analyses the costs of different methods for long-distance importation of low-carbon hydrogen to Europe and highlights concerns about high import targets from the European Commission and other governments. The report identifies potential least-cost options and also outlines several policy recommendations for developing a cost-effective, low-carbon hydrogen economy in Europe.


Executive Summary
Interest in hydrogen has grown in recent years as policymakers consider strategies for achieving the goal of full, economy-wide decarbonization over the next several decades. Because hydrogen can be produced in a low-carbon manner and emits no carbon dioxide at the point of use, clean hydrogen is seen as offering a potential solution for certain industrial processes and energy end-uses that are technically impossible or prohibitively expensive to decarbonize through other means, like electrification. According to some recent studies, decarbonization efforts can be expected to substantially increase global demand for low-carbon hydrogen, while also creating new impetus to develop the transport networks needed to connect low-cost producers of clean hydrogen with demand centers elsewhere in the world.
Large-scale transport of hydrogen over long distances poses significant cost and technology challenges, however — many of which stem from hydrogen’s fundamental properties, including its low volumetric energy density. To explore these issues, Clean Air
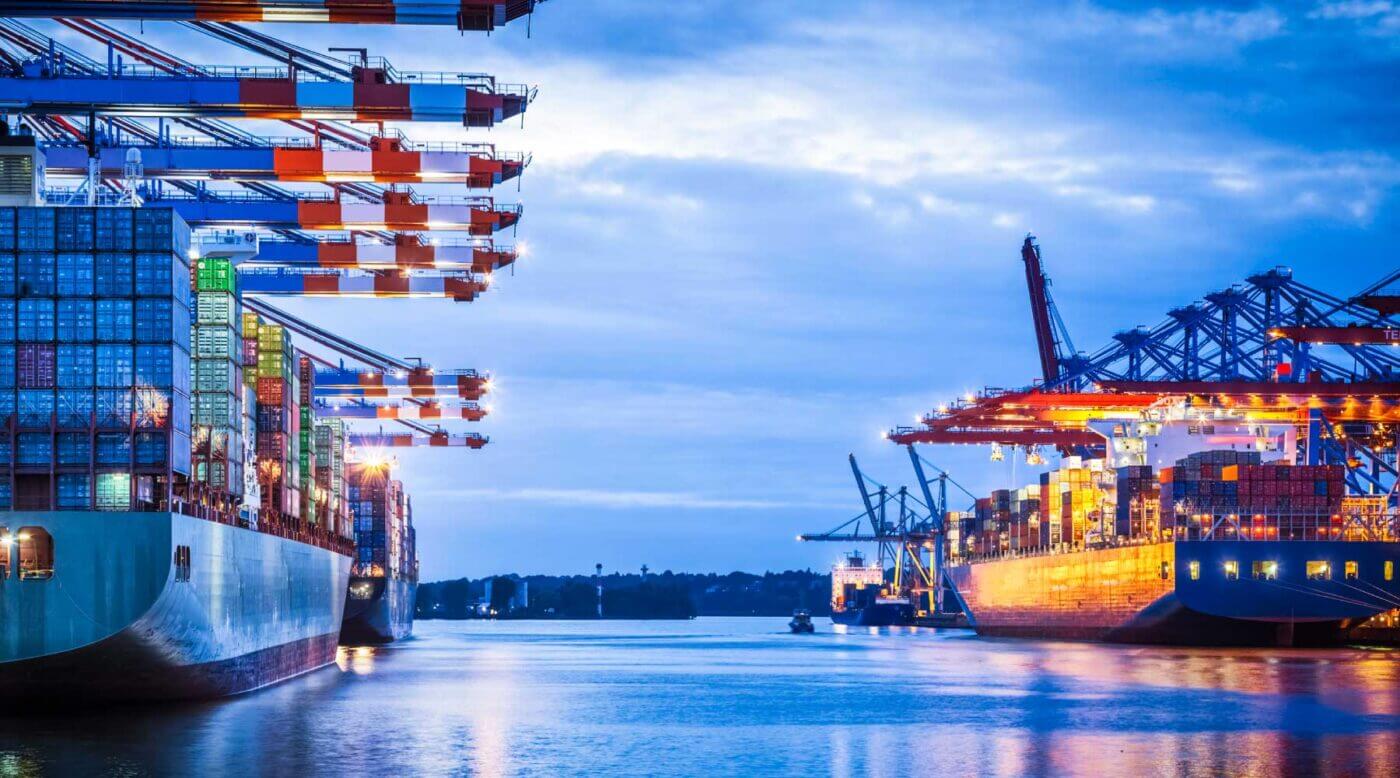
Task Force commissioned KBR Inc., a Houston-based consulting firm, to model the cost of different pathways for delivering low-carbon hydrogen from likely producing regions to Europe’s largest seaport, the Port of Rotterdam in the Netherlands.1 Specifically, the KBR analysis considered pipeline transport of gaseous hydrogen from Algeria and Norway and maritime (ship) transport of either liquid hydrogen, ammonia, or a liquid organic hydrogen carrier (methylcyclohexane) from Norway, the Arabian Gulf region, and North and South America. Estimates of overall cost per kilogram of hydrogen delivered to Rotterdam were developed for each of three total import volumes (250,000, 1 million, and 10 million tonnes per year), which were assumed to be reached in 2030, 2040, and 2050, respectively. By accounting for each element of the value chain in developing these cost estimates, the analysis aimed to elucidate the implications of different choices with respect to hydrogen carrier, mode of transport, and export location.
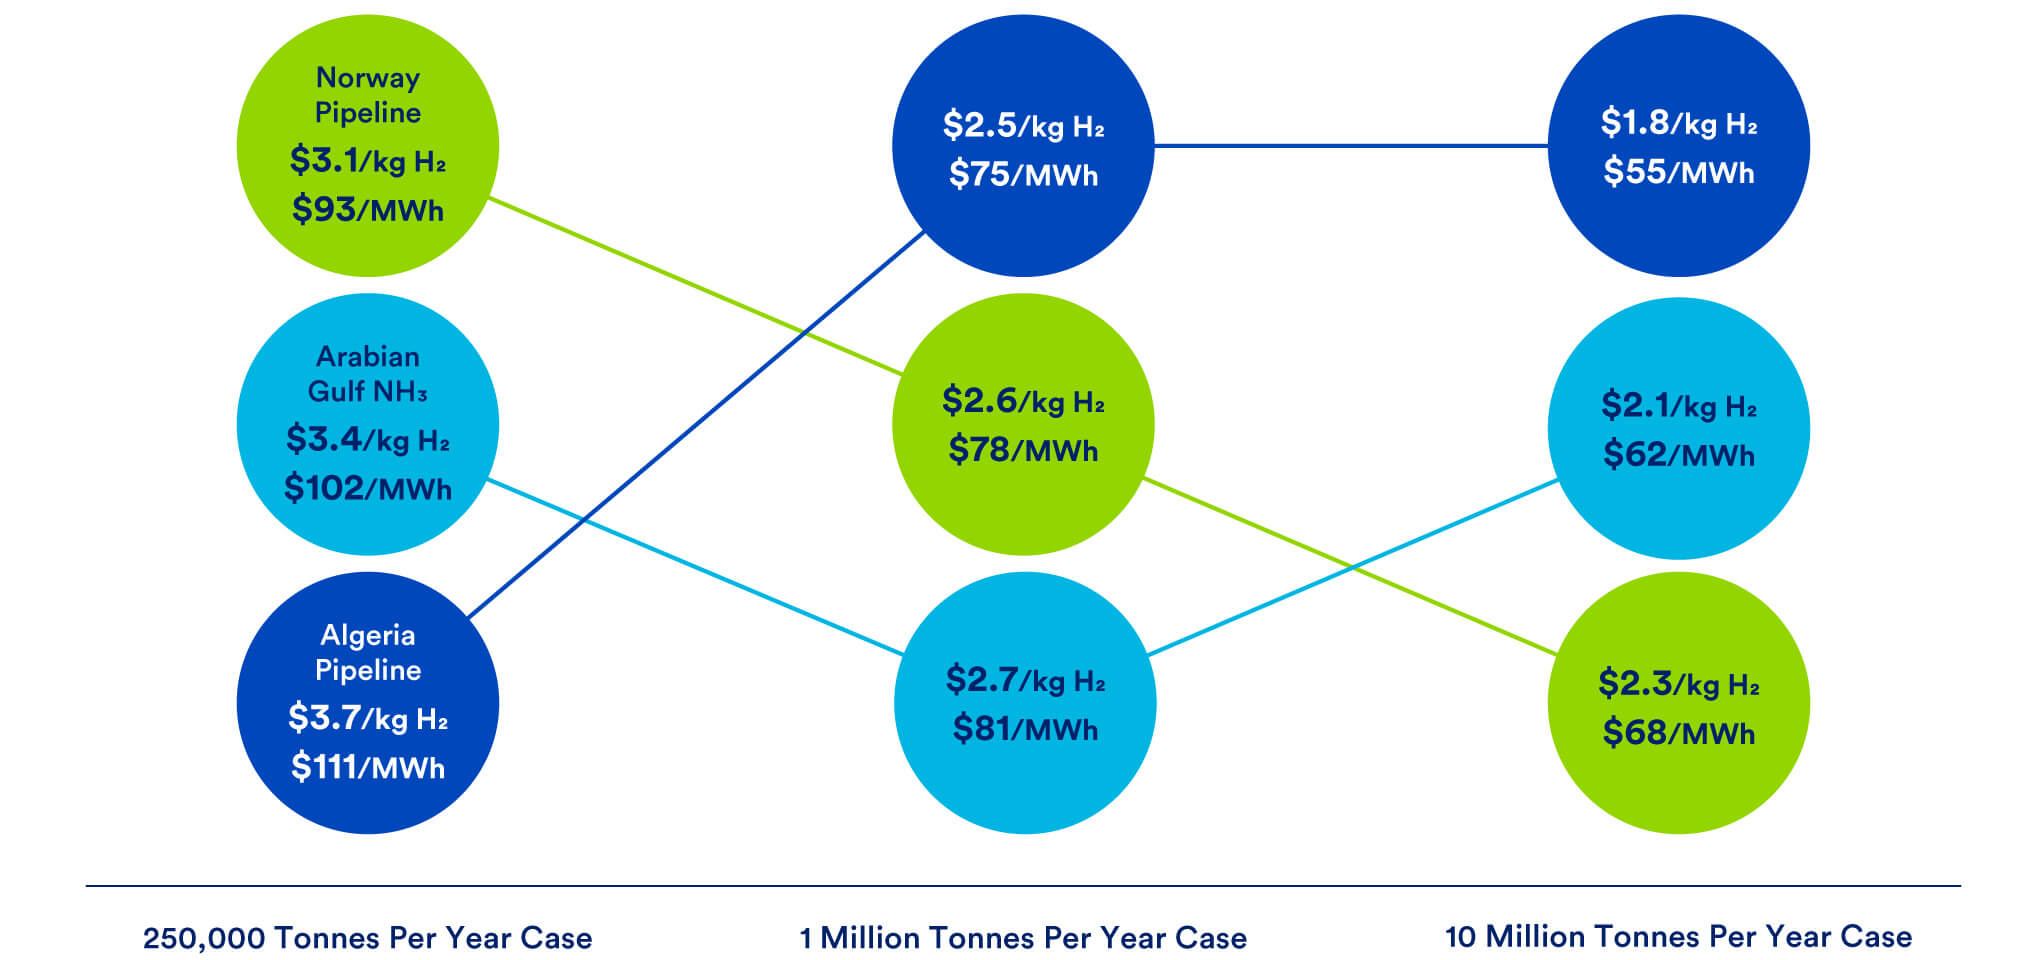
Figure ES-1 shows the different export locations included in the analysis, while Figure ES-2 shows results from the cost analysis for the three lowest-cost import pathways at each of the import volumes considered. Costs throughout this report are shown in U.S. dollars ($) per kilogram (kg) of hydrogen and per megawatt-hour (MWh) of hydrogen, where 1 MWh corresponds to the energy content of approximately 30 kg of hydrogen. Cost graphs in the main report are shown in $/kg; the appendix shows the same graphs converted to $/MWh.
Figure ES-1: Pathways for Importing Low-Carbon Hydrogen to Europe
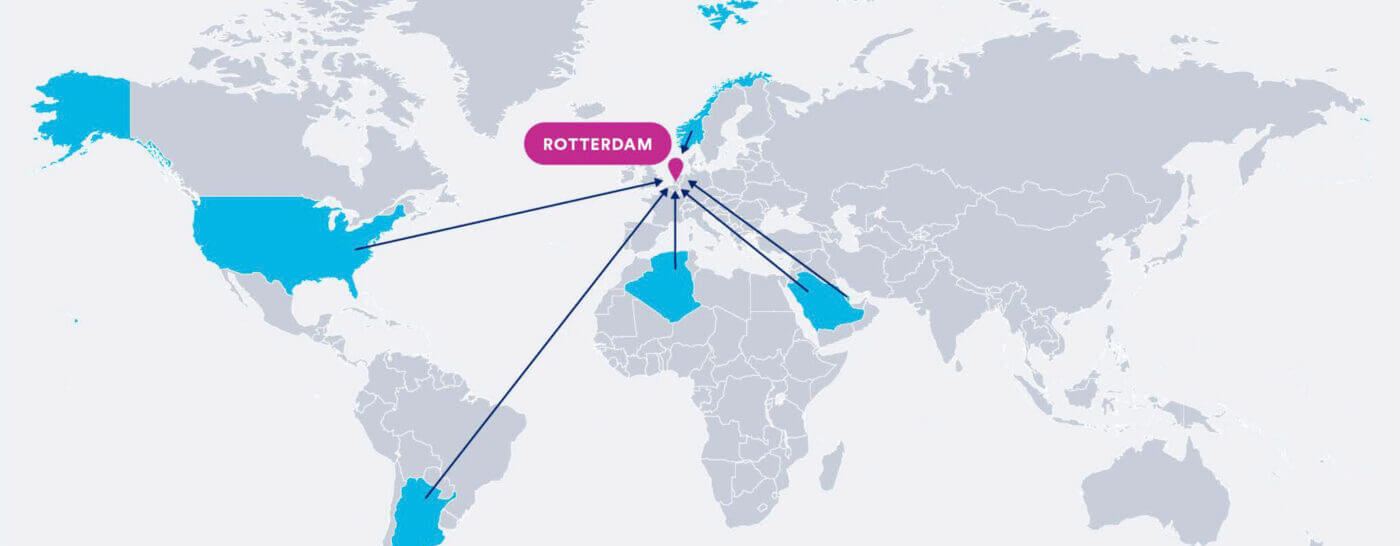
Figure ES-2: Lowest Levelized Cost of Delivered Hydrogen to the Port of Rotterdam Across Various Supply Chains
Two limitations of this study are worth noting. First, the analysis does not account for the additional, ‘last kilometer’ costs of delivering hydrogen to end-users, which could be substantial, nor does it attempt to predict future hydrogen prices. Hydrogen prices, and therefore costs to end-users, would certainly be higher — likely by a significant margin — than the KBR estimates suggest, but final prices to different users will depend on a host of market and regulatory factors, most of which are complex and extremely difficult to anticipate.2
This study also does not include a full lifecycle analysis of greenhouse gas or other emissions from the production and transport of hydrogen. In reality, upstream environmental considerations could be significant depending on the feedstocks, energy inputs, and methods used to generate and transport hydrogen. For purposes of this analysis, we stipulate that future hydrogen imports to Europe must qualify as ‘low-carbon’ and incorporate several simplifying assumptions accordingly: specifically, that imported hydrogen is produced in a low-carbon manner from natural gas, using zero-carbon energy inputs with carbon capture and sequestration at the hydrogen generation plant;3 that the fuels used by marine vessels to transport hydrogen emit little or no carbon at the point of use;4 and that any process heat needed to release hydrogen from another liquid carrier at Rotterdam is sourced from the hydrogen itself. As a practical matter, realizing some of these assumptions will present additional technical and policy challenges that, while outside the scope of this study, can be expected to be significant.
Findings from KBR’s cost analysis and other CATF work point to several high-level conclusions:
- Importing large quantities of hydrogen over long distances to Europe — whether by ship or pipeline — will be expensive and relatively energy inefficient. This is due to several inherent properties of hydrogen, particularly its low volumetric energy density.
- Transporting liquefied natural gas (LNG) to Europe and using it to produce hydrogen at the point of import (with low-carbon energy inputs and carbon capture) will likely be more feasible and cost-effective than importing low-carbon hydrogen from distant suppliers. This option was not considered in the KBR analysis but bears further exploration, especially since EU countries are currently building out an extensive LNG importing infrastructure following the disruption to European gas markets in early 2022.
- When transport via ship and transport via pipeline are both possible options, transporting hydrogen by pipeline consistently ranks as more cost-effective. Furthermore, it provides a simpler solution compared to the expansive maritime transport supply chain. However, it is likely that geopolitical considerations, rather than purely techno-economic factors, will dominate decision making over future pipeline development.
- Owing to economies of scale, costs per kilogram (or MWh) of delivered hydrogen decline with higher import volumes for all carriers and export locations.
- Natural gas prices have a large impact on the cost of delivered hydrogen in this analysis, because they are the main driver of operating costs for ‘blue’ hydrogen production. (The term ‘blue’ hydrogen refers to hydrogen produced in a low-carbon manner via steam methane reforming with carbon capture; this was the hydrogen production pathway assumed for purposes of this cost analysis). In fact, natural gas prices in the hydrogen- producing region account for as much as 20%–70% of the cost of delivered hydrogen across the supply chains and import pathways KBR considered.
- If hydrogen is transported in the form of a liquid carrier, such as ammonia, the processes involved in liberating pure hydrogen at the point of import can be expected to consume a significant portion of the energy carried by the hydrogen. Alternatively, liquefying pure hydrogen for transport incurs significant energy penalties for refrigeration and compression. These losses can be reduced with scale and technology improvements but will likely stay significant as they are inherent to the fundamental physics that govern each step in the supply chain.
- The use of uncracked ammonia rather than pure hydrogen in some applications could be cost-effective because it avoids the dehydrogenation step at the end of the value chain. In fact, uncracked ammonia offers the cheapest pathway for delivering hydrogen molecules in our analysis, beating even pipeline delivery of pure gaseous hydrogen although the product delivered is different. This is an important finding given expected demand for ammonia imports for use in fertilizer production or as a bunkering fuel.
Taken together, the findings from this study underscore the numerous hurdles to transporting hydrogen by sea, which include, but are not limited to, the inherent energy requirements (and potential emissions implications) of associated processes. Recognizing these hurdles, CATF concurs with the overall conclusion reached by a recent European Commission study, which found that most of the hydrogen needed to meet future European demand will likely be either (1) produced near the point of end-use or (2) imported by pipeline. Findings from this analysis also inform several high-level Clean Air Task Force policy recommendations:
- Plans for hydrogen deployment should be limited to “no-regrets” sectors that include existing uses of hydrogen as a chemical feedstock in addition to future uses, where no other energy-efficient or cost-effective decarbonization options are available.
- Hydrogen demand forecasts should be re-examined to develop more realistic estimates. At present, some prominent policy targets, such as the European Commission’s goal of supplying the European market with 20 million tonnes per year of clean hydrogen by 2030, seem to lack a clear basis. Realistic projections, grounded in thoughtful analysis, are critical to designing effective and ultimately successful policies.
- Any hydrogen that is imported into Europe must be truly low-carbon and climate-beneficial. To ensure these criteria are met, the European Union urgently needs to implement a credible and consistent international system for certifying clean hydrogen. Such a system should be based on rigorous analysis of lifecycle greenhouse gas emissions across the entire value chain, including fugitive upstream methane emissions for hydrogen production from natural gas and manufacturing and construction emissions associated with primary energy inputs to the hydrogen production process. Analysis across the entire hydrogen value chain and clarity about certification standards and requirements are crucial to create market confidence and minimize investment risks.
- Import pathways that rely on the long-range transport of liquefied pure hydrogen or on a liquid organic hydrogen carrier that requires dehydrogenation to liberate pure hydrogen at the point of import should be avoided as they do not make sense from an energy, emissions, or economic standpoint. Capital requirements and levelized costs for these pathways are far higher (in some cases close to double) the costs for importing hydrogen in the form of uncracked ammonia.
- Given its substantial cost advantages relative to other hydrogen carriers, it will be important to (1) identify what part of Europe’s expected hydrogen demand could be met by uncracked ammonia and (2) spur development of related technologies and infrastructure in applications where no more efficient or cost-effective decarbonization option exists.
- The enormity of the decarbonization challenge demands care in designing public policies and directing public resources to prioritize the most promising and cost-effective technologies first. Option value is important but so is avoiding expensive investments in infrastructure that is inherently inefficient or unlikely to be used. The reality is that additional technologies and a deeper paradigm change will be needed to achieve net zero greenhouse gas emissions in Europe and elsewhere — current policies are not enough. Thoughtful assessment of the full range of strategies that could be available to reduce greenhouse gas emissions will significantly reduce the risk, both of missing the European Union’s climate and emissions targets and of creating stranded assets through the misallocation of public funds.
Additional Findings from KBR’s Cost Analysis of Potential Pathways for Importing Low-Carbon (‘Blue’) Hydrogen to the Port of Rotterdam
- Of the pathways for delivering hydrogen to Rotterdam considered in this analysis, three options consistently ranked as most cost-effective across all supply chain volumes: gaseous hydrogen by pipeline from Norway and Algeria and ammonia via maritime shipping from the Arabian Gulf. Estimated cost per kilogram (or MWh) of delivered hydrogen is lower for these options than for all other geographies and transport options, including ship transport of liquid organic hydrogen carriers (such as methylcyclohexane) and liquid hydrogen.
- For pipeline transport, Norway is the lowest-cost exporter at the smallest supply volume considered (250,000 tonnes hydrogen per year). At higher pipeline transport volumes, Algeria, because of its lower natural gas prices, is the lowest cost exporter.
- Among the maritime transport options considered, ammonia emerges as the lowest-cost carrier, regardless of export location. The Arabian Gulf is the lowest-cost exporter, largely due to a combination of low natural gas prices, geographic proximity to Rotterdam, and competitive construction costs.
- Estimated costs for ammonia imports from locations in North and South America are on the order of 10%–15% higher than estimated costs for ammonia imports from the Arabian Gulf (the modelled cost differential ranges from $0.20 to $0.40 per kilogram of delivered hydrogen, or $6–$12 per MWh of delivered hydrogen, depending on overall import volume).
- Across all supply chain volumes, importing hydrogen in the form of ammonia from the U.S. Gulf Coast consistently ranked as the fourth most cost-effective option. The U.S. position could improve further as a result of widening natural gas price differentials between U.S. and European hubs and recently passed policy incentives in the United States, including a new federal tax credit for clean hydrogen production in the Inflation Reduction Act of 2022.
1. Introduction
There is growing consensus around the world that full decarbonization will require an expanded suite of advanced, climate-friendly technologies, including fuels that can be produced in a low-carbon manner and do not emit carbon dioxide at the point of use. Such fuels are needed to address energy needs for certain industrial processes and sectors that cannot be readily decarbonized through other means, such as electrification.
Interest in hydrogen as a leading candidate to fill the need for low-carbon fuel has increased in recent years. For hydrogen to play a significant role, however, cost-effective, environmentally beneficial technologies for producing, storing, transporting, and utilizing hydrogen will need to be developed and rapidly scaled. Finding ways to move bulk quantities of hydrogen cost- effectively over long distances is a particular challenge in this context, both as a precondition for the emergence of competitive global markets for clean hydrogen and to enable high-demand regions such as Europe to access lower-cost suppliers elsewhere in the world.
To explore these issues, CATF commissioned KBR Inc., a Houston-based consulting firm with expertise in engineering and technology, to model the cost of different pathways for delivering low-carbon hydrogen from likely producing regions to Europe — specifically, to the Port of Rotterdam in the Netherlands. Rotterdam was selected as the point of entry for imported hydrogen in this analysis because the port is a significant economic driver in Europe, a major bunkering hub, and adjacent to numerous heavy industrial facilities that can potentially use imported hydrogen. In addition, the Rotterdam port operator has announced plans to develop capacity to handle 20 million tonnes per year of hydrogen imports by 2050.
By developing detailed cost estimates for each element of the low-carbon value chain, the analysis was designed to elucidate the implications of different choices with respect to hydrogen carrier, mode of transport, and export location. This report summarizes results from KBR’s analysis, highlighting key takeaways for policy makers and stakeholders.5
The remainder of this report is organized as follows: Section 2 provides background and context for the analysis. Section 3 describes potential hydrogen carriers and value chains. Section 4 reviews the study approach and methodology, noting important assumptions and data sources. Section 5 presents results. Section 6 provides a brief discussion of the current policy context for investments in clean hydrogen. Section 7 concludes by discussing policy recommendations and areas for further research.
2. Background & Context for the Analysis
2.1 The case for low-carbon hydrogen
Internationally, there is wide agreement not only about the urgency of rapidly reducing greenhouse gas emissions to avoid the worst impacts of climate change, but also about the main elements of a viable strategy for achieving full decarbonization on an economy-wide basis. Comprehensive efforts to increase energy efficiency and to electrify as many energy end-uses as possible, while also rapidly decarbonizing the electricity supply, are clearly high priorities and have received considerable attention from policy makers and analysts. But there is also growing recognition that additional technologies and policies will be needed to address certain sectors and end-uses that are difficult to electrify.
This study focuses on low-carbon hydrogen, which is drawing renewed attention6 as a potential option for decarbonizing certain energy-intensive sectors (such as heavy, long-haul transportation) and industries (such as cement, iron, and petrochemicals).7 As part of a portfolio of advanced clean energy technologies, hydrogen offers several advantages: It can be produced with low emissions from a variety of feedstocks using a variety of methods, it emits no carbon dioxide (CO2) at the point of use, and it is versatile and can be used in a range of applications.
For these reasons, many expert analyses — and, increasingly, many governments and business leaders — see a role for hydrogen in the clean energy transition that needs to occur globally over the next several decades.
To realize this potential, however, significant hurdles must be overcome, chief among them:
- Developing and rapidly scaling cost-effective low-carbon technologies for producing, transporting, storing, and distributing hydrogen.
- Expanding hydrogen use into sectors where it currently has no market presence. A related challenge — that of developing the large-scale hydrogen transport systems needed to link higher-cost consuming regions to lower-cost producing regions — provides the impetus for this study.
2.2 Hydrogen basics: current market and emerging challenges
Hydrogen is already in wide use for a variety of non-energy applications, primarily as a chemical feedstock in petroleum refining, to make ammonia for fertilizer, and in the production of methanol. Other common industrial uses for hydrogen can be found in food and drug production, glass and semiconductor manufacturing, and metals fabrication. In fact, growth in these sectors has sharply boosted worldwide demand for hydrogen, which reached 94 million tonnes8 in 2021, according to the International Energy Agency (IEA).9
Hydrogen is an abundant element in Earth’s environment but because it occurs in nature only in combination with other chemical elements, pure hydrogen (H2) must be produced from hydrogen-containing feedstocks. The least costly and most widely used method for producing pure hydrogen today is steam methane reforming (SMR): in this process, natural gas, which is largely composed of methane (CH4), reacts with high-temperature steam in the presence of a catalyst to generate pure hydrogen gas and carbon monoxide. Another conventional production method involves gasifying coal or another hydrocarbon feedstock (for example, coal mixed with biomass or plastic waste).
In recent years, SMR using natural gas has accounted for almost two-thirds of global hydrogen production, with coal gasification (primarily in China) accounting for another 19% of global production.10 As currently practiced, these methods are relatively carbon intensive: In fact, hydrogen production today is estimated to account for 6% of global natural gas consumption and close to 900 million tonnes of CO2 emissions annually.11
Hydrogen can also be produced by passing an electrical current through water to split the hydrogen atoms from the oxygen atoms in a process called electrolysis. This method can be carbon free if the electricity used is generated by non-emitting sources such as renewable generators (e.g., wind and solar) or nuclear power. The term ‘green’ hydrogen is generally understood to refer to hydrogen produced via electrolysis using renewably generated electricity. Electrolysis, however, is currently much more expensive than other modes of hydrogen production; for this reason, it accounts for only about 2% of current hydrogen production worldwide.12
Adding technology to capture and store CO2 emissions so they do not enter the atmosphere offers a means to greatly reduce emissions from current, fossil-fuel-based modes of hydrogen production: Low-carbon hydrogen produced via SMR with carbon capture is often called ‘blue’ hydrogen to distinguish it from either conventional (‘grey’) hydrogen or low-carbon ‘green’ hydrogen. This production pathway should be paired with strict methane emission controls upstream of the hydrogen production facility.
Costs for producing grey hydrogen using conventional SMR or gasification are highly dependent on fossil-fuel prices. In 2021, according to the IEA, the levelized cost of producing hydrogen from natural gas in different parts of the world ranged from a low of $1 per kilogram (kg) to as much as $2.5 per kg (around $30–$75 per MWh of hydrogen). The same IEA report estimates that adding carbon capture to reduce CO2 emissions increases production costs for blue hydrogen to around $1.5–$3 per kg (around $45– $90 per MWh), while current costs for hydrogen production via renewable-powered electrolysis range from $4–$9 per kg (around $120–$270 per MWh).13
Reducing production costs for low-carbon hydrogen is obviously one priority for enabling increased use of hydrogen as part of a broader decarbonization strategy. But hydrogen production is only one part of the value chain for clean hydrogen—substantial investments
and technology improvements will also be needed to build out hydrogen transport, storage, and distribution infrastructure and to adapt end-use technologies so they can operate efficiently on hydrogen fuel, which has different combustion properties than conventional fossil fuels.
Transport and storage, in particular, present challenges because pure hydrogen, which exists as a gas at ambient temperatures and pressures, is far less dense than conventional fossil fuels and must be compacted, through compression and/or refrigeration, to be handled efficiently.14
Once compressed, gaseous hydrogen can be moved economically via pipeline, but for bulk transport by ship, the hydrogen must either be liquefied or converted to a chemical “carrier” that is easier to transport and store in large quantities. As discussed in more detail in Section 3, either approach involves several process steps, each of which adds technological and operational complexity to the overall value chain and entails significant energy and efficiency losses—with concomitant impacts on cost.15
3. Potential Carriers and Value Chains for a Global Hydrogen Market
This section describes the different hydrogen carriers and transport options considered for this analysis, identifying the main components of the value chain in each case and highlighting potentially important energy, infrastructure, and handling considerations. For transport via marine vessel, the analysis considers liquid hydrogen, methylcyclohexane (MCH), and ammonia. Pipeline transport was considered as the only viable option for large-scale imports of gaseous hydrogen where geographically feasible; it is discussed after the marine carrier options (Section 3.5).16
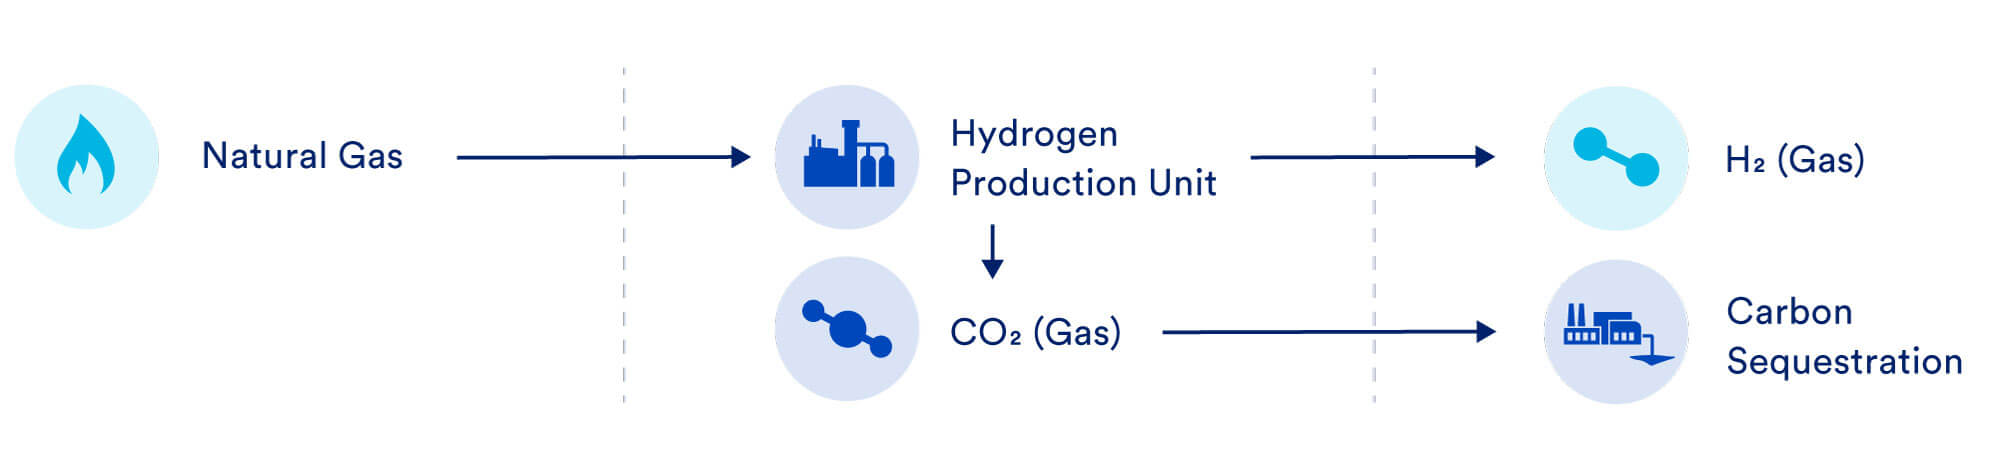
3.1 The hydrogen generation plant
The value chain for all hydrogen carriers considered in this analysis begins with a plant that uses natural gas as a feedstock and employs auto thermal reforming (ATR) to produce pure hydrogen gas from methane. Several currently proposed ATR plants have target capture rates ranging from more than 95% to 97%. This analysis assumes 97% capture of CO2 emissions from future ATR hydrogen plants; it further assumes that all captured CO2 is compressed and disposed of at or near the hydrogen generation plant.
Figure 1: Hydrogen Value Chain – Low Carbon Hydrogen Production
3.2 Liquid hydrogen (LH2)
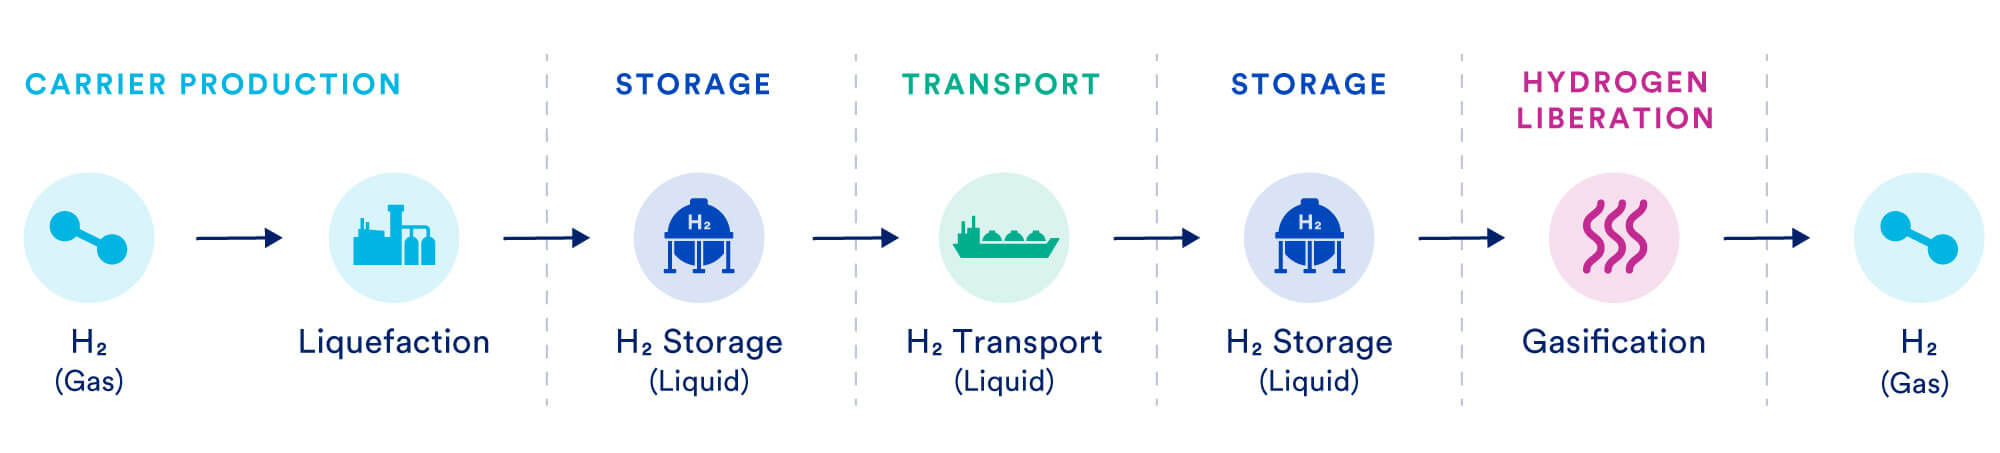
Figure 2 illustrates the value chain for liquid hydrogen, which begins with compressing and cooling gaseous hydrogen at the export location to liquefy it for export. The power requirements for this step are substantial, as the hydrogen must be cooled to, and subsequently kept at, a temperature of -253°C. For purposes of this analysis, KBR assumes that liquid hydrogen would also serve as the marine bunker fuel during transport — in other words, vessels carrying liquid hydrogen would consume a portion of their cargo on the way to the import destination. The need to maintain liquid hydrogen at very low temperatures throughout storage, transport, and handling operations has significant energy and cost implications for this value chain; it also adds to infrastructure costs — including costs for cryogenic storage vessels, cryogenic piping, and other specialized equipment — at both the import and export locations.
Because of these liquefaction and storage requirements, liquid hydrogen is the most capital intensive among the import pathways considered. Handling large volumes of liquid hydrogen would also entail a significant scaleup from today’s capacities. Furthermore, the transportation of liquid hydrogen by ship has been proven but is years away from being an established, commercial, and dependable method for transporting large quantities of hydrogen at anything close to the scale of liquefied natural gas (LNG). Challenges include managing boil-off during storage, loading and unloading operations, and limiting supply chain emissions.
Figure 2: Hydrogen Value Chain – Liquid Hydrogen as a Carrier
3.3 Methylcyclohexane (MCH)
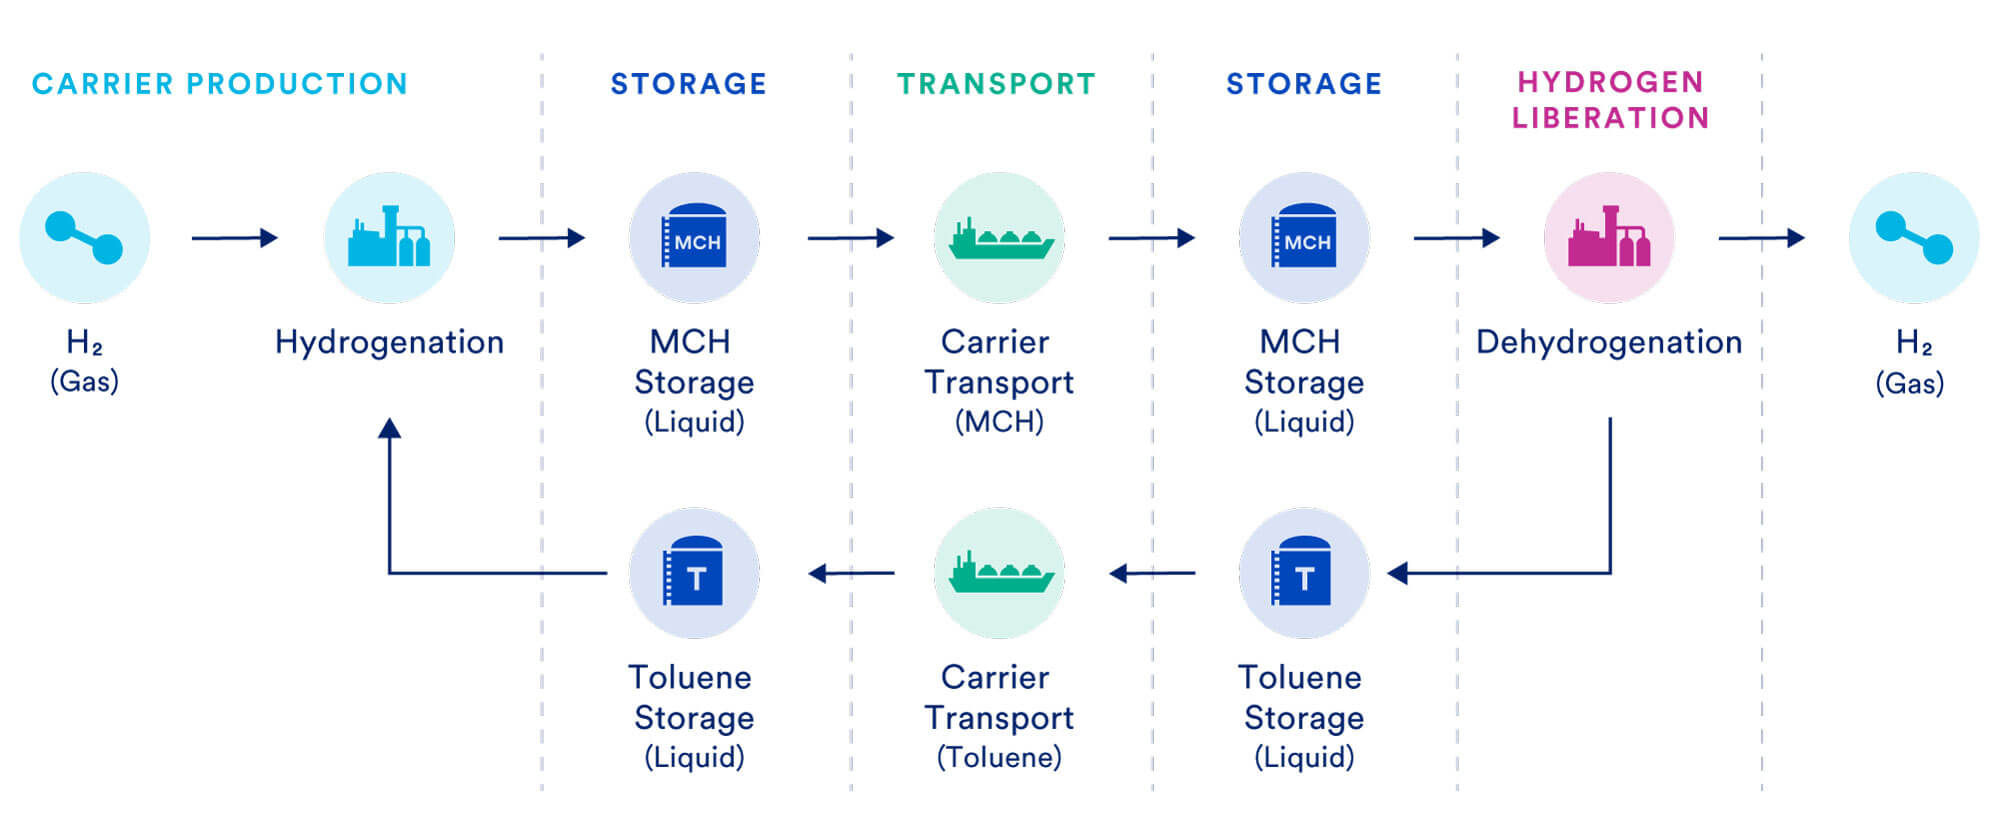
In this value chain, gaseous hydrogen is used to hydrogenate toluene, an organic solvent, to form liquid methylcyclohexane (MCH), another organic solvent which is suitable for marine transport. Once MCH reaches the import destination, it is dehydrogenated to release hydrogen and the original toluene molecule, which is then shipped back to the exporter to restart the cycle. From a storage and transport perspective, liquid organic hydrogen carriers (LOHC) like MCH and toluene have several advantages: both are liquid at ambient temperatures, have relatively low volatility and toxicity, and are otherwise similar to familiar crude-oil-based fuels, which simplifies handling and infrastructure requirements.
However, the toluene/MCH value chain also has distinct drawbacks. First, extensive storage infrastructure, for both toluene and its hydrogenated form, MCH, is required at the export and import terminals. The need to reload toluene and ship it back to the export location is another. Also, only about 6% of MCH, by weight, consists of hydrogen. This means that much of the shipping cost and energy for this import pathway goes to ferrying the organic liquid carrier rather than the hydrogen itself. KBR’s analysis assumes that ships carrying MCH will operate on LNG. The requirement to supply large volumes of toluene is a further challenge, especially considering that toluene is largely a by-product of refining.
Importantly, this choice of carrier incurs heavy energy penalties at the end of the value chain, owing to the substantial heat and power inputs required to dehydrogenate MCH and deliver purified hydrogen as the end product. The dehydrogenation process alone can consume 43%–52% of the hydrogen produced at the generation plant and substantially increases the initial production volume required to deliver an equivalent quantity of hydrogen at the import location. Finally, while the process for hydrogenating toluene to MCH is technologically mature and already in use in several industries, the same is not true for the reverse process of dehydrogenating MCH to liberate pure hydrogen.
Figure 3: Hydrogen Value Chain – Toluene / MCH as a Hydrogen Carrier
3.4 Ammonia (NH3)
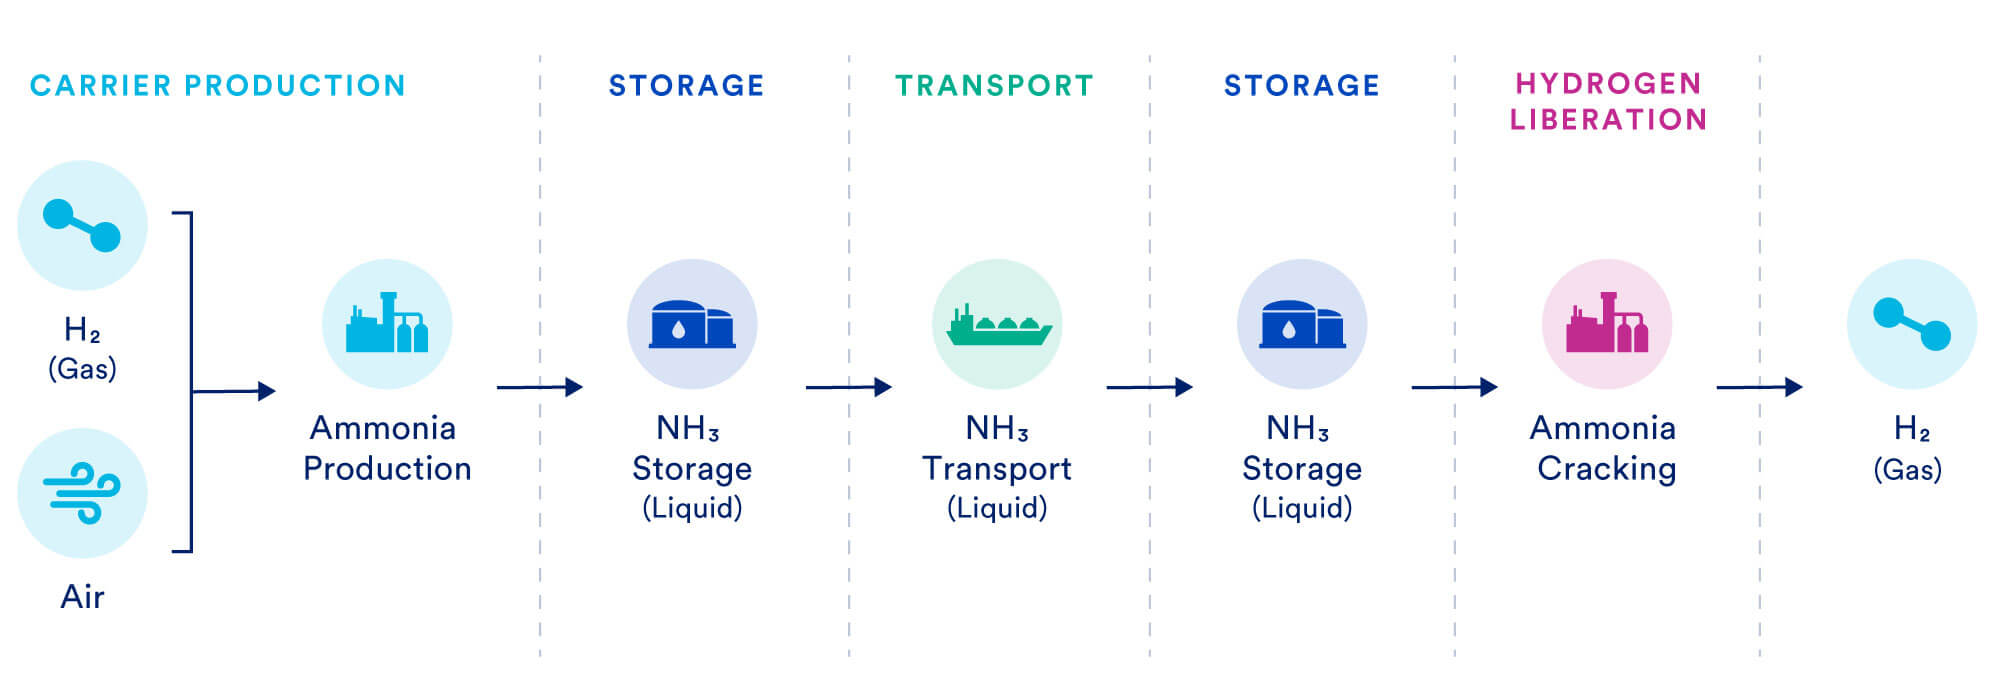
Ammonia is another chemical that has drawn interest as a potential carrier for large-scale hydrogen transport. Ammonia is already one of the most widely used chemicals in the world—as a result, production methods are well-developed, storage and transport requirements are well understood, and extensive infrastructure for producing and distributing ammonia, including ships and terminals, already exists. Ammonia is also much less demanding than LH2 in terms of the temperature and pressure conditions required to keep it liquid — this means that it can be stored in common ‘Type C’ pressurized tanks and requires no specialized handling or equipment. Nonetheless, ammonia presents certain toxicity hazards that could be amplified by a large increase in maritime shipments of ammonia. (The roughly 20 million tons of ammonia that are currently transported by ship each year account for less than 15% of today’s global market for ammonia.)
Figure 4 illustrates the value chain for ammonia. As indicated in the figure, KBR assumed use of the Haber-Bosch process, which already accounts for most ammonia production in the world, to convert gaseous hydrogen and air to ammonia. This part of the value chain requires heat and electricity inputs, but the technologies and processes involved are mature.
By contrast the technologies needed to efficiently dehydrogenate (or ‘crack’) ammonia to liberate hydrogen once it reaches the import destination are still in relatively early stages of development. Present methods for cracking ammonia require significant energy inputs.
Because of these requirements, KBR also considered a case where ammonia is delivered without dehydrogenation (cracking) for use in applications such as ship bunkering, power generation, and other end markets. While this case does not afford an apples- to-apples comparison with the value chains for other hydrogen carriers, which are assumed to deliver high- purity hydrogen as the ultimate end-product, it may be a realistic option for reducing the costs of transitioning to low-carbon hydrogen in some energy applications. As with liquid hydrogen, the analysis assumes that ships transporting ammonia use ammonia as bunker fuel — in effect, consuming some of their cargo enroute.
Figure 4: Hydrogen Value Chain – Ammonia as a Hydrogen Carrier
3.5 Pipeline transport of gaseous hydrogen
In contrast to the liquid carrier options considered in this analysis, the value chain for pipeline transport of gaseous hydrogen is relatively simple. The energy-intensive steps of liquefying hydrogen or converting it to a carrier at the export location and then reversing the process to liberate hydrogen at the import location are completely avoided and other requirements for storage and transportation are also greatly reduced. Gaseous hydrogen must be compressed for pipeline transport, but the associated energy requirements are relatively modest.17
Nonetheless, the low volumetric energy density of hydrogen means that the energy needed to deliver hydrogen by pipeline is three times the energy required to deliver an equivalent amount of energy in the form of natural gas. Delivering hydrogen by pipeline has the advantage of being more technologically mature and proven than the carrier/marine pathways. Distance, however, is a greater constraint for pipeline transport, which limits the number of potential export locations that could cost-effectively deliver low-carbon hydrogen to Europe via this pathway. In addition, building out new pipeline infrastructure — particularly across national borders — may present political difficulties that would not apply to marine shipments.
4. Methodology
4.1 Scope of analysis and study design
The KBR analysis considered four different pathways for hydrogen delivery (liquid hydrogen, MCH, and ammonia delivered via maritime transport and gaseous hydrogen delivered via pipeline transport), six potential export locations (Algeria, Argentina, Norway, Qatar, Saudi Arabia, and the United States); and three import volumes (250,000, 1 million, and 10 million tonnes per year) which were assumed to be reached in 2030, 2040, and 2050, respectively. In addition, KBR considered two scenarios for ammonia as a hydrogen carrier: in one scenario, ammonia delivered to Europe would be directly used as a fuel; in the other scenario, ammonia would be ‘cracked’ to liberate pure hydrogen after reaching Europe.
Figure 5: Pathways for Low-Carbon Hydrogen Imports to Europe
Table 1: Key Parameters in Study Design
| Variable | Specification |
|---|---|
| Volume of Delivered H2 (tonnes/yr) | 250,000 /1,000,000/ 10,000,000 |
| Carriers | LH2 / NH3 / MCH |
| Marine Transport (LH2 / NH3 / MCH) | Norway / U.S. / Argentina / Qatar / Saudi Arabia |
| Pipeline Transport (H2 gas) | Norway / Algeria |
| No. of Cases | 71 |
Table 1 summarizes the combinations of parameters that were considered for this analysis; together they resulted in 71 distinct cases. (As already noted, hydrogen imports were assumed to enter the Port of Rotterdam in all cases.) For Algeria, only pipeline transport of gaseous hydrogen was considered; for Argentina, Qatar, Saudi Arabia, and the United States, only marine transport of liquid hydrogen, liquid ammonia, or MCH were considered. For Norway, both marine transport of liquid hydrogen, ammonia, or MCH and pipeline transport of gaseous hydrogen were considered.
For each case, KBR estimated levelized cost of delivered hydrogen (LCOH), in U.S. dollars per kilogram ($/kg), taking into account all the major components of the hydrogen value chain. These components include:
- Hydrogen production, including the hydrogen generation plant and carbon capture and sequestration system.
- Carrier production and export, including carrier production and synthesis, export storage, and export jetty.
- Transport via marine vessel or pipeline (pipeline transport was considered for the Algeria and Norway export locations only).
- Import, including import jetty, carrier storage, and regasification/liberation of hydrogen at the import facility where applicable.
KBR’s cost estimates were developed using an in-house modeling tool that accounts for location-specific capital and operating expenditures (CAPEX and OPEX, respectively) across the different segments of the hydrogen value chain (production, export, transport, and import) to calculate overall LCOH at the import location. CAPEX for each supply chain component includes costs for materials, construction, design and project management, and insurance and certification, as well as contingency costs.18 OPEX for each component includes costs for fixed operations and maintenance, power consumption, natural gas feedstocks and non-hydrogen fuels (e.g., LNG in the cases that involve marine transport of MCH).19 Cost and price data are from 2021 and are not adjusted for inflation (see further discussion of data sources and assumptions in Section 4.2). Costs for fees and taxes were not included and the analysis does not account for any carbon emissions credits that might be generated by using or importing low-carbon hydrogen. A discounted cash flow model with a discount rate or weighted average cost of capital of 10% and an assumed plant life of 30 years was used to calculate levelized cost.
To calculate estimated costs for hydrogen imports by pipeline, KBR used PIPESIM to size the necessary pipelines, assuming hydrogen inlet pressures of 80 barg (typical of existing European gas transmission infrastructure) and installation of compression stations where the outlet pressure dropped below 40 barg. Line sizes were set so that compressor stations would be needed at intervals of approximately 100 kilometers. CAPEX and OPEX were estimated using IHS Que$tor software (reflective of the first quarter of 2021), where OPEX includes imported electric power for pipeline compressor stations at an assumed cost of $80 per megawatt-hour (MWh). Power to operate pipeline compression stations accounts for a significant share of OPEX costs for pipeline transport. Offshore pipelines in the Norway and Algeria cases were sized to avoid the requirement for subsea compression.
4.2 Key assumptions, study limitations, and data sources
As discussed in previous sections, KBR was asked to conduct a techno-economic comparison of costs for different potential pathways to supply Europe with imports of ‘blue hydrogen’ (i.e., hydrogen made by reforming natural gas using low-carbon energy inputs and carbon capture). The analysis focuses on blue hydrogen because the greater technological maturity and lower cost of this production method mean that it has the potential to scale more rapidly than ‘green hydrogen’ produced via electrolysis. However, it is important to note that results from the KBR analysis pertaining to costs for the export, transport, and import segments of the hydrogen value chain would apply equally to hydrogen made using other feedstocks and processes.
Several limitations of the study design should be acknowledged at the outset. First, the cost analysis encompasses hydrogen delivery only to the Port of Rotterdam—it does not account for the costs of ‘last kilometer’ delivery to final customers, a crucial step in the value chain that will impose its own transmission, storage, and distribution infrastructure requirements. Follow-up study would be needed to investigate the costs and logistics of delivering imported hydrogen to potential users that are not necessarily in the vicinity of major receiving hubs, such as Rotterdam.
A related point is that KBR’s cost estimates for producing and importing hydrogen are not the costs that end- users could expect to see. On the contrary, costs to end-users would reflect the additional distribution and delivery costs just noted, as well as other market factors — thus, final costs would certainly be higher than production costs and likely much higher, given hydrogen’s challenging physical properties, than costs for incumbent fuels. Until better-developed markets and pricing mechanisms begin to emerge, it will remain extremely difficult to predict future hydrogen prices.
In terms of environmental considerations, this study does not include a full lifecycle analysis of greenhouse gas or other emissions from the production and transport of hydrogen.20 In reality, upstream emissions could be significant depending on the technologies and energy sources used throughout the value chain. Instead, the analysis stipulates that future hydrogen imports to Europe will need to qualify as ‘low-carbon’ and incorporates several assumptions to satisfy that requirement:
- Hydrogen is produced by combining natural-gas-based ATR with CCS technology to achieve 97% capture of CO2 emissions at the hydrogen generation plant. The cost of carbon capture at the ATR plant is included in KBR’s cost estimates for hydrogen production.
- Electricity requirements for the hydrogen generation plant and at other points in the value chain are met using clean electricity (e.g., renewables, nuclear, or fossil fuel with carbon capture).
- Other energy requirements — including for bunker fuel during marine transport and for process heat at different points in the value chain (for example, to liberate hydrogen from carriers such as ammonia or MCH) — are self-supplied by the production of additional hydrogen and factored into the mass balances used to calculate cost for delivered hydrogen at the import location. This explains why there is variation across different export regions in terms of the initial quantity of hydrogen that must be produced to deliver the same quantity of hydrogen in Rotterdam. In the case of MCH shipments, the analysis assumes that LNG is used as the bunker fuel during marine transport and includes those costs.
- CO2 captured at the hydrogen generation plant is permanently stored away from the atmosphere in a suitable nearby geologic reservoir. For cost estimation purposes, the analysis assumes that the cost of sequestering CO2 captured during the hydrogen production process is $20 per tonne at all locations. In reality, of course, cost for geologic sequestration would vary from location to location, depending on a variety of factors, including distance to the sequestration site, reservoir characteristics and pumping requirements, etc. (For comparison, a recent analysis by the U.S. Environmental Protection Agency estimates costs for transporting and storing CO2 at $10–$28 per tonne).21
- Strict methane emission control measures are in place upstream of the hydrogen production facility.
Each of the above assumptions, it should be emphasized, carries its own considerable cost, technology, and infrastructure requirements. In fact, substantial investments and policy interventions will be needed to expand zero-carbon electricity supplies, commercialize cost-effective carbon capture technology, develop industrial-scale systems for the geologic sequestration of captured CO2, and achieve near-zero upstream methane emissions — all of which will be critical to decarbonize future hydrogen supply chains. Technology improvements will also be needed downstream of the hydrogen generation plant,
for example to develop large-capacity ships that can operate on liquid hydrogen or ammonia22 and to improve hydrogenation and dehydrogenation processes for hydrogen carriers like MCH and ammonia.
Table 2 identifies key parameters and assumptions for this analysis, noting the basis for the assumption or data source where applicable. Additional details may be found in the full KBR report.
Table 2: Assumptions and Data Sources in KBR Cost Estimates
| Variable | Assumption ($=U.S. dollar) | Source |
|---|---|---|
| Skilled and unskilled labor rates | Vary by location | Compass International Publications benchmark |
| Construction costs | Varies by location depending on labor rates and location factor, where location factor takes into account import and productivity factors. Calculated assuming local fabrication and construction and accounting for local labor productivity factors and wage estimates. | KBR internal |
| Price for clean electricity | Algeria: $43/MWh Argentina: $46/MWh Norway: $30/MWh Qatar: $47/MWh Saudi Arabia: $46/MWh United States: $35/MWh | IEA 2021 |
| Price for natural gas | Algeria: $0.75/MMBtu Argentina: $2.94/MMBtu Norway: $10.16/MMBtu Qatar: $1.25/MMBtu Saudi Arabia: $1.25/MMBtu United States: $3.24/MMBtu | KBR internal information for Algeria; International Gas Union Wholesale Price Report (2020-2021) for Argentina, Qatar, and Saudi Arabia; Average TTF Prices for 2019 & 2021 – HIS for Norway. |
Cost of CO2 Sequestration | All locations: $20 per tonne of CO2 | KBR internal |
| Average speed for marine transport vessels | 15 knots | KBR internal based on industry experience |
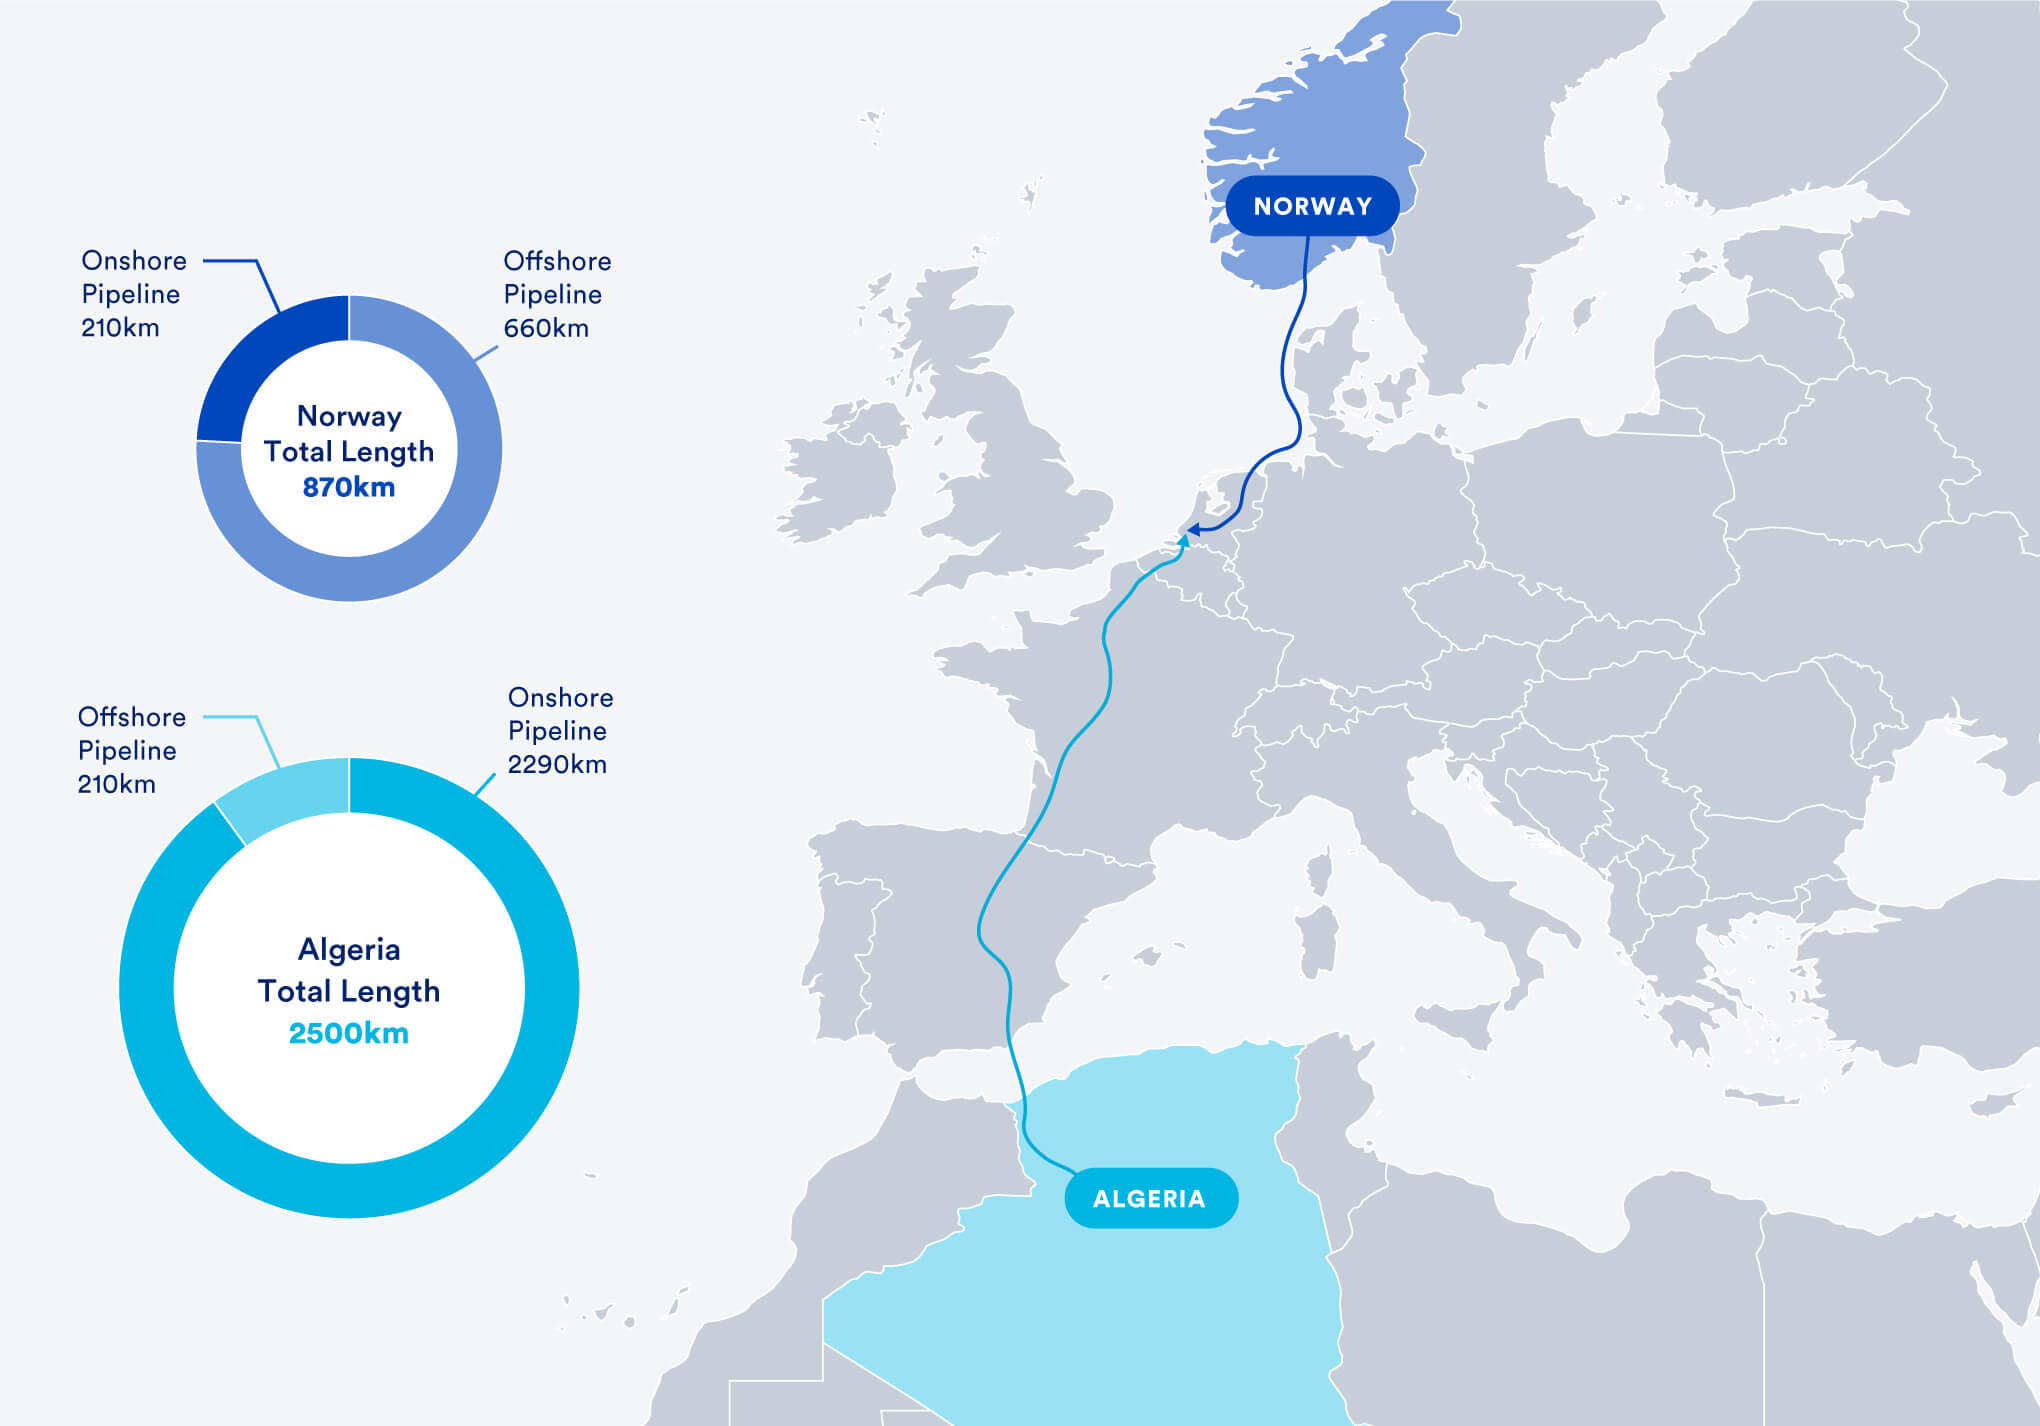
| Distance from export terminal to Port of Rotterdam | Algeria: 2,500 kma (pipeline only) Argentina (Buenos Aires): 14,496 km/7,827 nautical miles (marine only) Norway (Oslo): 870 kmb (pipeline); 1315 km/710 nautical miles (marine) Qatar (Doha): 13,364 km/7,216 nautical miles (marine only) Saudi Arabia (Jeddah): 8,627 km/4,658 nautical miles (marine only) United States (Houston): 11,464 km/6,190 nautical miles (marine only) | KBR internal Notes: a 210 km is subsea (Medgaz to Spain) – source McKinsey Hydrogen Insights Report 2021. b Based on Europipe II, distance from Karsto to Dornum is 660 km plus 210 km to Northern Netherlands. |
| Pipeline CAPEX and OPEX | Vary by location | Calculated using IHS Que$tor software (2021 Q1) estimating tool |
5. Results
5.1 Overall cost of delivered hydrogen
Figure 6 summarizes KBR’s estimates of overall cost for the different export locations, hydrogen carriers, and import volumes considered. In all cases, the costs shown are on a levelized basis, in U.S. dollars, per kilogram of delivered hydrogen taking into account any additional hydrogen production required to meet upstream fuel needs. Note that Figures 6–8 do not include costs for the uncracked ammonia value chain; because this value chain does not deliver an equivalent product (i.e., pure hydrogen), cost estimates for uncracked ammonia are discussed separately, at the end of this section. The same figures showing cost results in U.S. dollars per MWh of delivered hydrogen may be found in the appendix.
Figure 6: Levelized Cost of Hydrogen ($/kg H2)
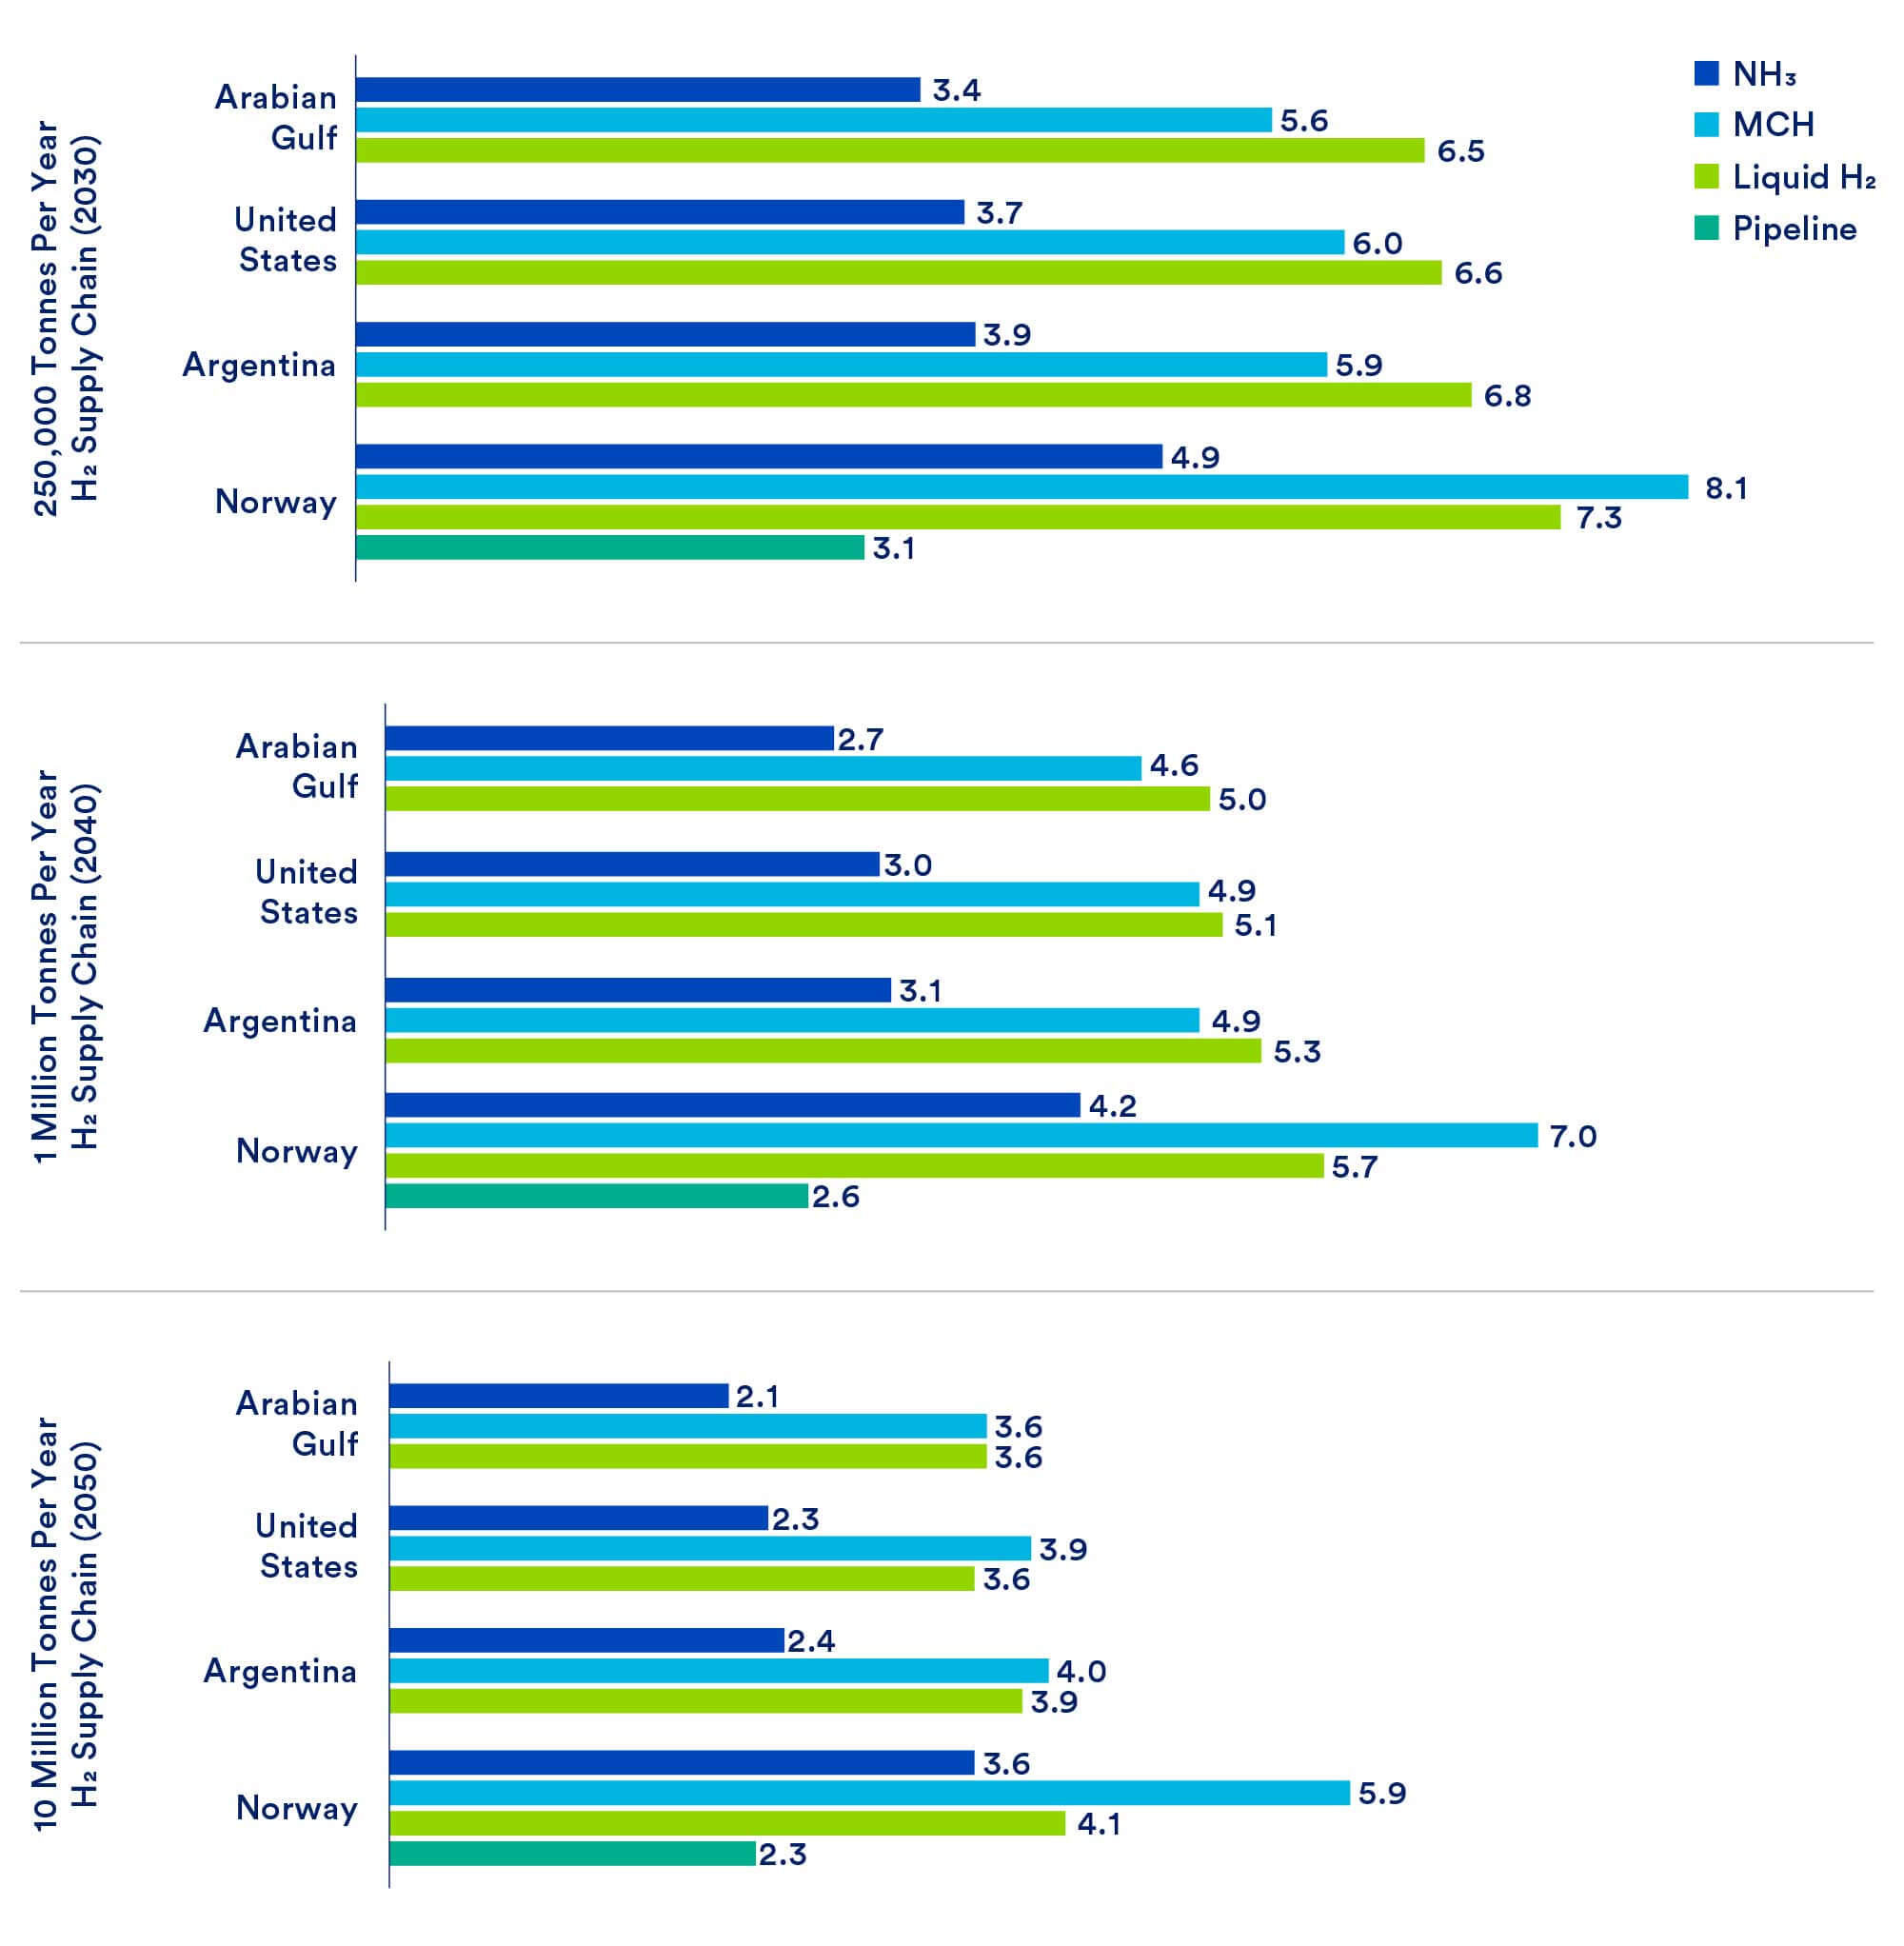
Figure 7 shows that Norway, because of its relative proximity to Rotterdam, is the least-cost source for hydrogen delivered via pipeline at the lowest supply volume considered (250,000 tonnes per year). At higher supply volumes, which would allow for larger diameter pipelines, Algeria — with lower-cost natural gas compared to Norway — becomes the least-cost source despite being farther away.
Figure 7: Levelized Cost of Hydrogen by Pipeline in U.S. Dollars ($) per kg
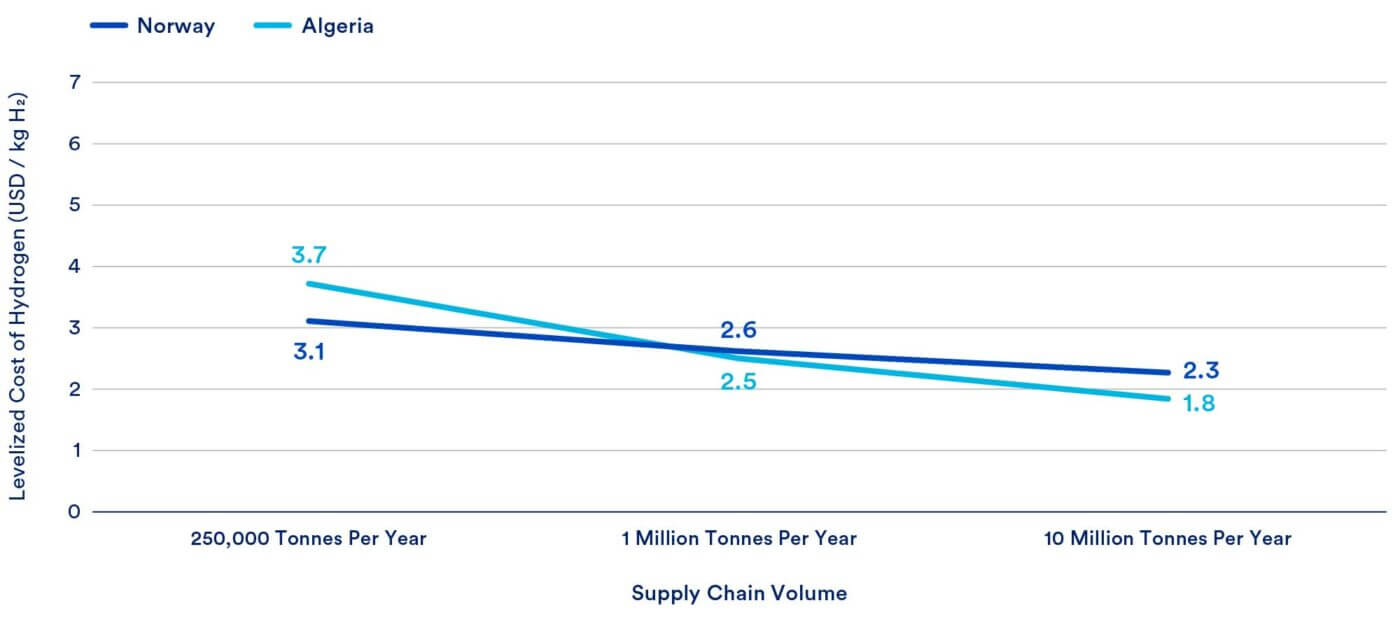
Figure 8 compares the least-cost export location/hydrogen carrier options at each supply volume considered. It indicates that the least-cost pipeline option has a $0.2–$0.3 per-kilogram ($6–$9 per-MWh) cost advantage over the least-cost marine-transport option (i.e., cracked ammonia sourced from the Arabian Gulf) at all the import volumes and export locations considered.
Figure 8: Lowest Levelized Cost of Hydrogen Across Various Supply Chains
Among potential export regions for marine shipments, the Arabian Gulf is the least-cost source for all types of hydrogen carrier considered and at all supply volumes. This is due to a combination of advantages with respect to shipping distance, natural gas feedstock price, and a competitive capital investment structure. Norway is the most expensive source for marine imports, largely due to high feedstock costs and higher construction costs for hydrogen producing and exporting infrastructure.
Among liquid hydrogen carriers that can be transported by ship, ammonia is the least costly option across all export locations and at all supply volumes. Costs for liquid hydrogen and MCH are higher than for ammonia in all cases because of the greater infrastructure and energy requirements associated with the full value chain for these options.
Comparing KBR’s cost estimates for ammonia across different export locations, the Arabian Gulf region has a consistent cost advantage but the cost differential between Arabian Gulf and North or South America is modest compared to the cost difference between ammonia and other liquid hydrogen carriers. Specifically, ammonia from the United States or Argentina is estimated to cost from $0.20 to $0.40 more per kg ($6– $12 more per MWh) of hydrogen delivered to Rotterdam than ammonia from the Arabian Gulf, depending on the overall supply chain volume. This roughly 10%– 15% cost differential suggests that regions other than the Arabian Gulf could be competitive as suppliers of low-carbon hydrogen to future global markets if they make the necessary investments in production and export capability.
Finally, the KBR results show that costs for delivered hydrogen decline at higher supply volumes for all carriers and export locations, owing to economies of scale.
Table 3 shows estimated costs for imports of uncracked ammonia from different export locations (additional figures in $/MWh are provided in the appendix.) As noted previously, ammonia can be directly used as a fuel or feedstock in certain applications, thereby avoiding the dehydrogenation step needed to liberate pure hydrogen at the end of the value chain. This substantially lowers costs, such that marine imports of uncracked ammonia from all export locations except Norway are more cost- effective than pipeline transport of hydrogen gas. It is important to emphasize, however, that the estimates shown in Table 3 assume that ammonia, not hydrogen, is delivered as the end product. However, further technology development would be needed to expand direct end-use opportunities for ammonia.
Table 3: Hydrogen Equivalent Cost Results for Uncracked Ammonia
Levelized Cost of H2 Delivered to Rotterdam as Uncracked Ammonia ($ per kg)
| 250,000 tonnes/year | 1 million tonnes/year | 10 million tonnes/year | |
|---|---|---|---|
| Arabian Gulf (Doha, Qatar) | 2.3 | 1.8 | 1.4 |
| United States (Houston) | 2.5 | 2.0 | 1.6 |
| Argentina (Buenos Aires) | 2.5 | 2.1 | 1.6 |
| Norway (Oslo) | 3.4 | 3.0 | 2.5 |
As already noted, gaseous hydrogen delivered by pipeline is the least costly import option for all the cases examined in KBR’s analysis. Figure 9 shows total installed pipeline cost for each of the pipeline delivery cases considered. As one would expect, pipeline costs are consistently lower for Norway than for Algeria because Norway is substantially closer to Rotterdam (Figure 10) and pipeline costs increase at higher import volumes because of the added capacity needed to handle larger flows of hydrogen. When total pipeline cost is divided by total imports, however, the per-kilogram cost of delivered hydrogen falls at higher import volumes (reflecting economies of scale) and Algeria, with lower natural gas costs than Norway, becomes the least-cost export region despite its greater distance from Rotterdam.
Figure 9: Pipeline Total Installed Cost ($ Millions)
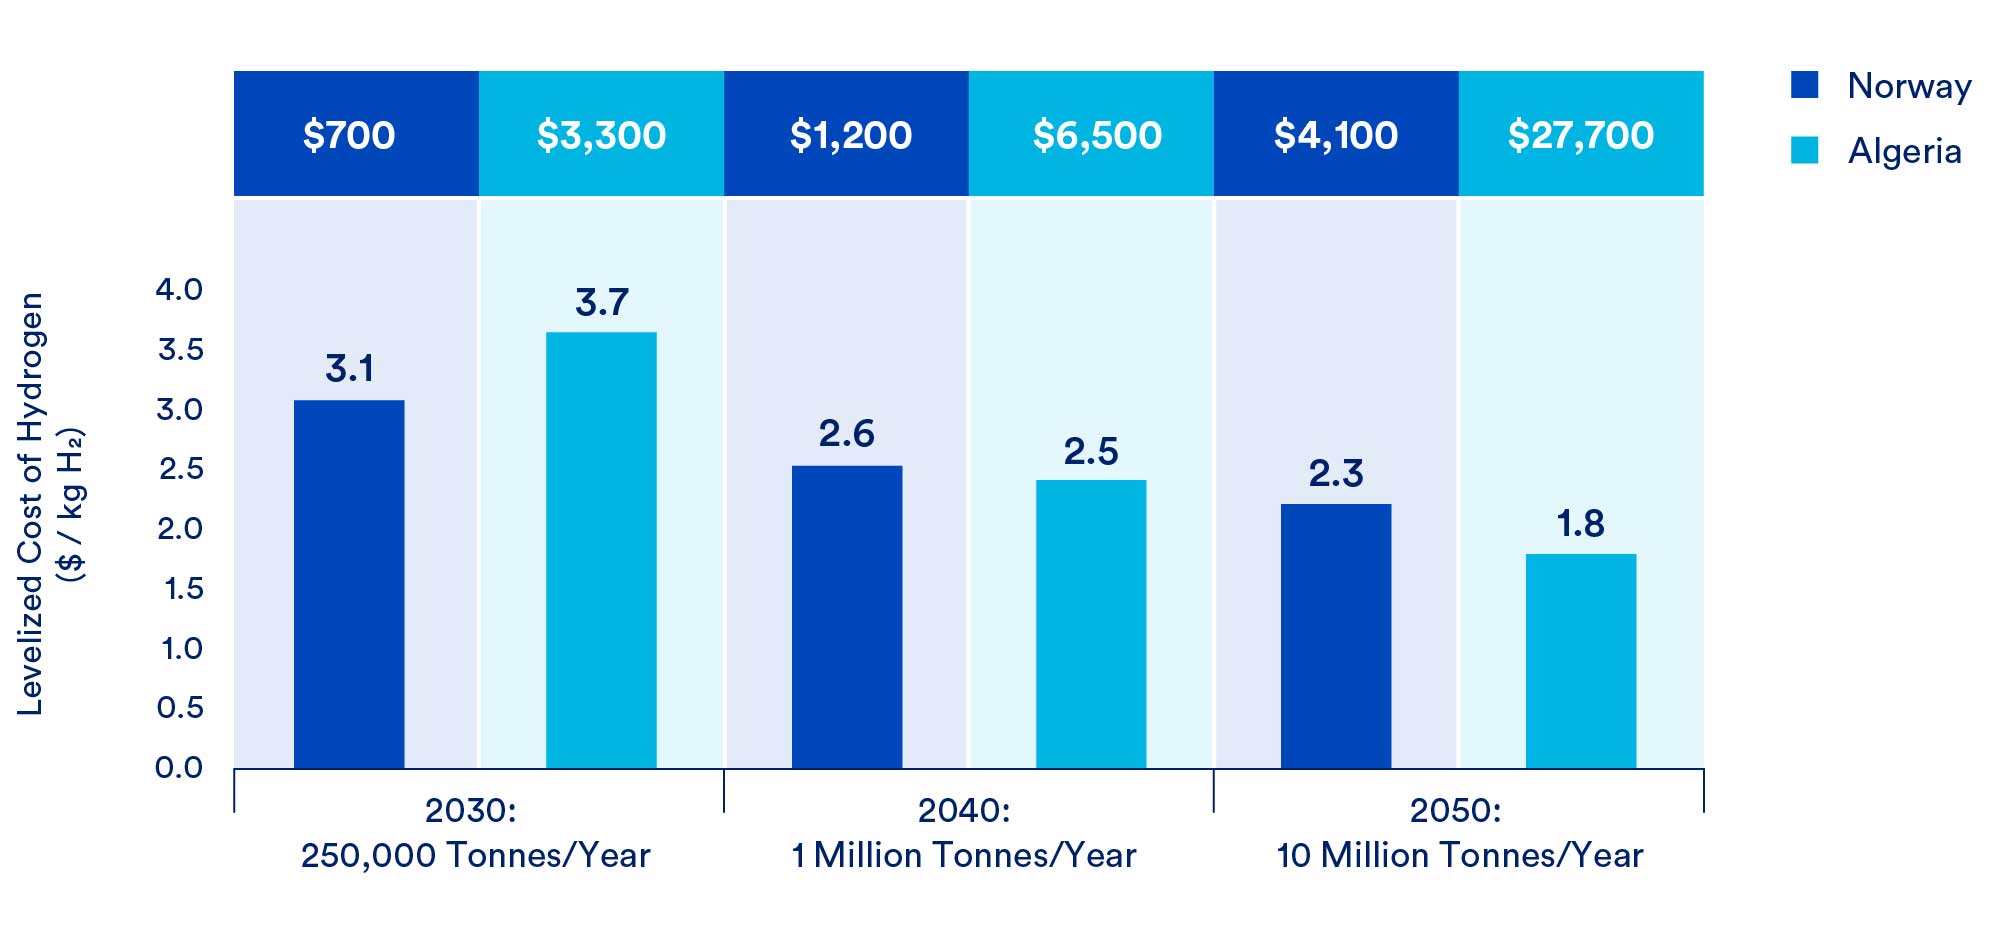
Figure 10: Pipeline Distance to Rotterdam for Norway and Algeria
5.2 Components of overall cost
Figure 11 illustrates supply chain costs for hydrogen carriers produced in the Arabian Gulf at different import volumes. We focus on these results because the Arabian Gulf is the export location that offers the lowest overall cost of delivered hydrogen for all the marine carriers considered. (Similar cost breakdowns for other export locations are provided in the full KBR report; see footnote 3. Cost breakdowns in $/MWh of delivered hydrogen are provided in the appendix to this report.) It bears noting, however, that the breakdown of capital costs is generally the same irrespective of export location. Also, capital costs for the import portion of the value chain — including costs for storage terminals and dehydrogenation processes at the receiving port — are the same regardless of the export location.
Figure 11: Cost Breakdown for Different H2 Carriers Imported from the Arabian Gulf
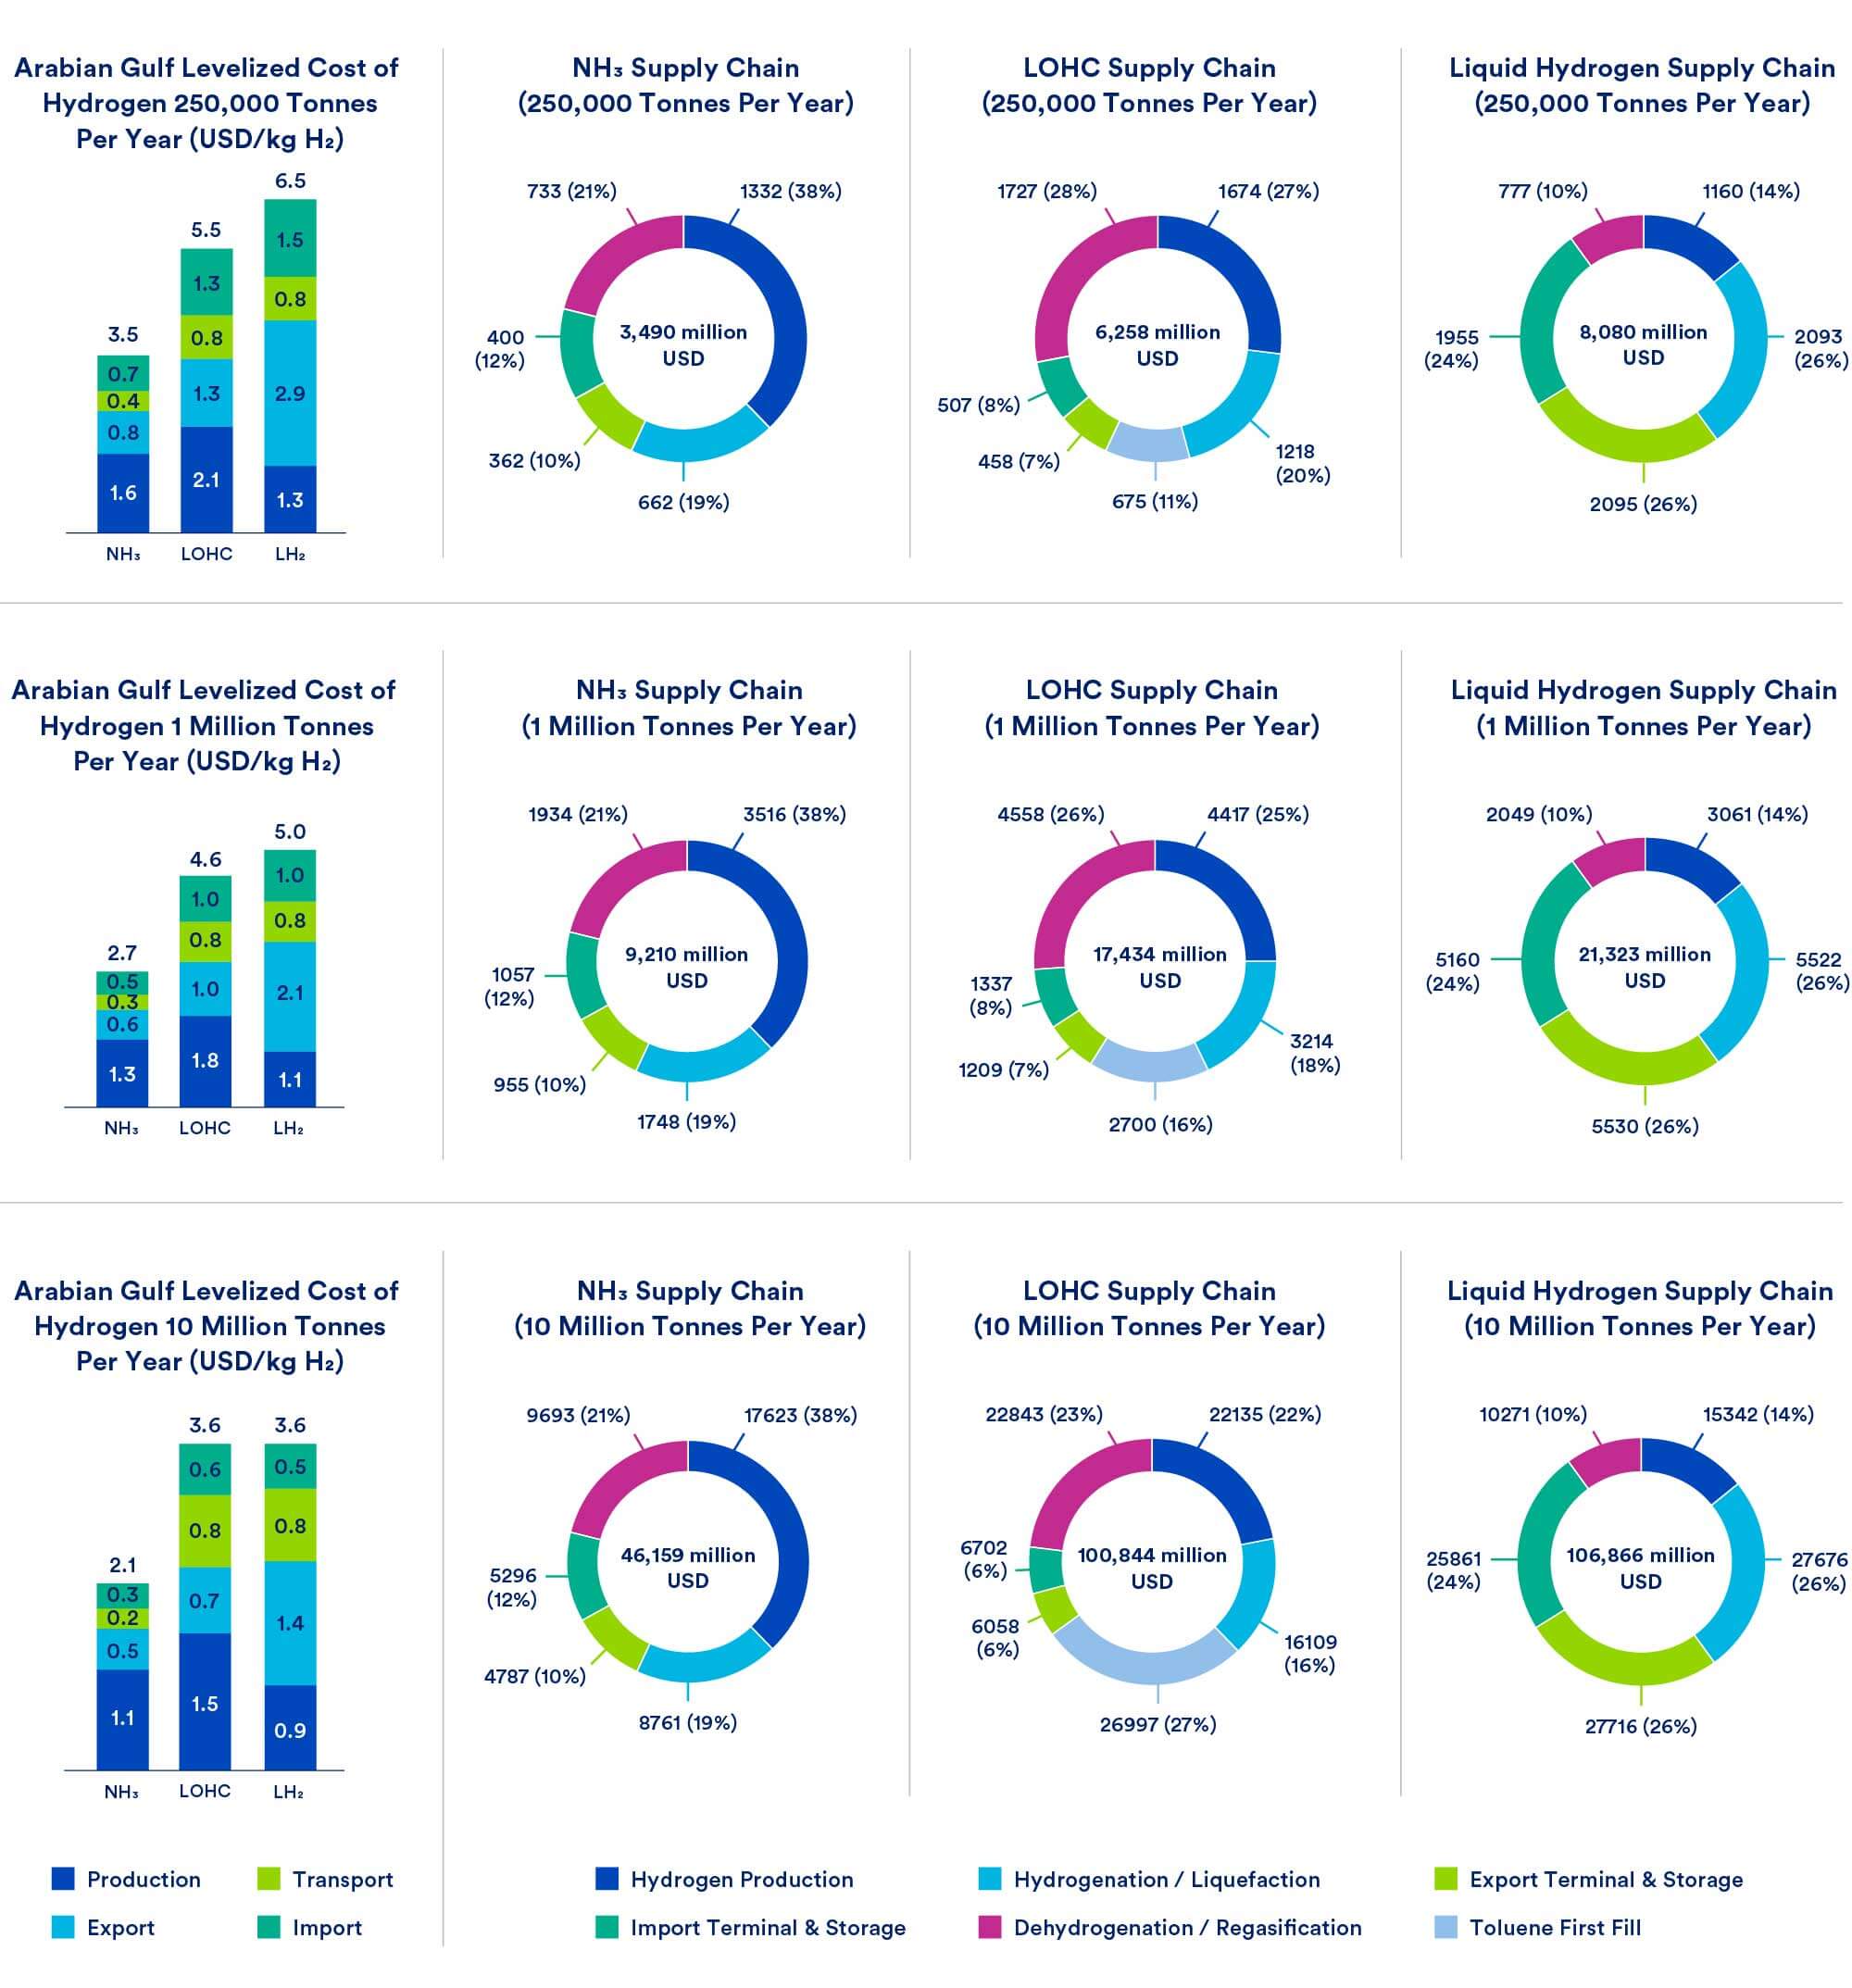
All the carrier options considered incur significant capital expenses in the hydrogen production, hydrogenation/ liquefaction, and dehydrogenation/gasification steps
of the supply chain, but capital expenses for the dehydrogenation step are particularly high for MCH.
Similarly, liquid hydrogen is an outlier for the very high capital expenses associated with constructing export and import terminals and storage facilities—this is due to the special refrigeration and compression demands of this carrier. Because of these demands, liquid hydrogen emerges as the most expensive carrier, with higher costs than even MCH in most cases.
Figure 12 breaks down estimated costs for the production, export, transport, and import steps of the value chain for cracked ammonia from different export regions (we focus on cracked ammonia in this comparison because it is the preferred — i.e., least-cost — carrier for pure hydrogen delivered by marine transport regardless of export location). The figure, which uses KBR’s results for an annual import volume of 250,000 tonnes, serves to highlight the importance of natural gas prices, which are the main driver of operating costs for hydrogen production. In fact, the price of natural gas in the producing region accounts for 20%–70% of the estimated cost for delivered hydrogen across the supply chains and import pathways KBR considered. Not surprisingly, the higher the price of natural gas, the more important a factor it becomes as a driver of hydrogen production costs. Thus, differences in natural gas prices account for a large share of the difference in delivered cost of hydrogen between the Arabian Gulf, as the lowest-cost producing region, and Norway as the highest-cost producing region.
Figure 12: Levelized Cost of Hydrogen Breakdown ($/kg H2) 250,000 Tonnes Per Year H2 Supply Chain – NH3 Carrier
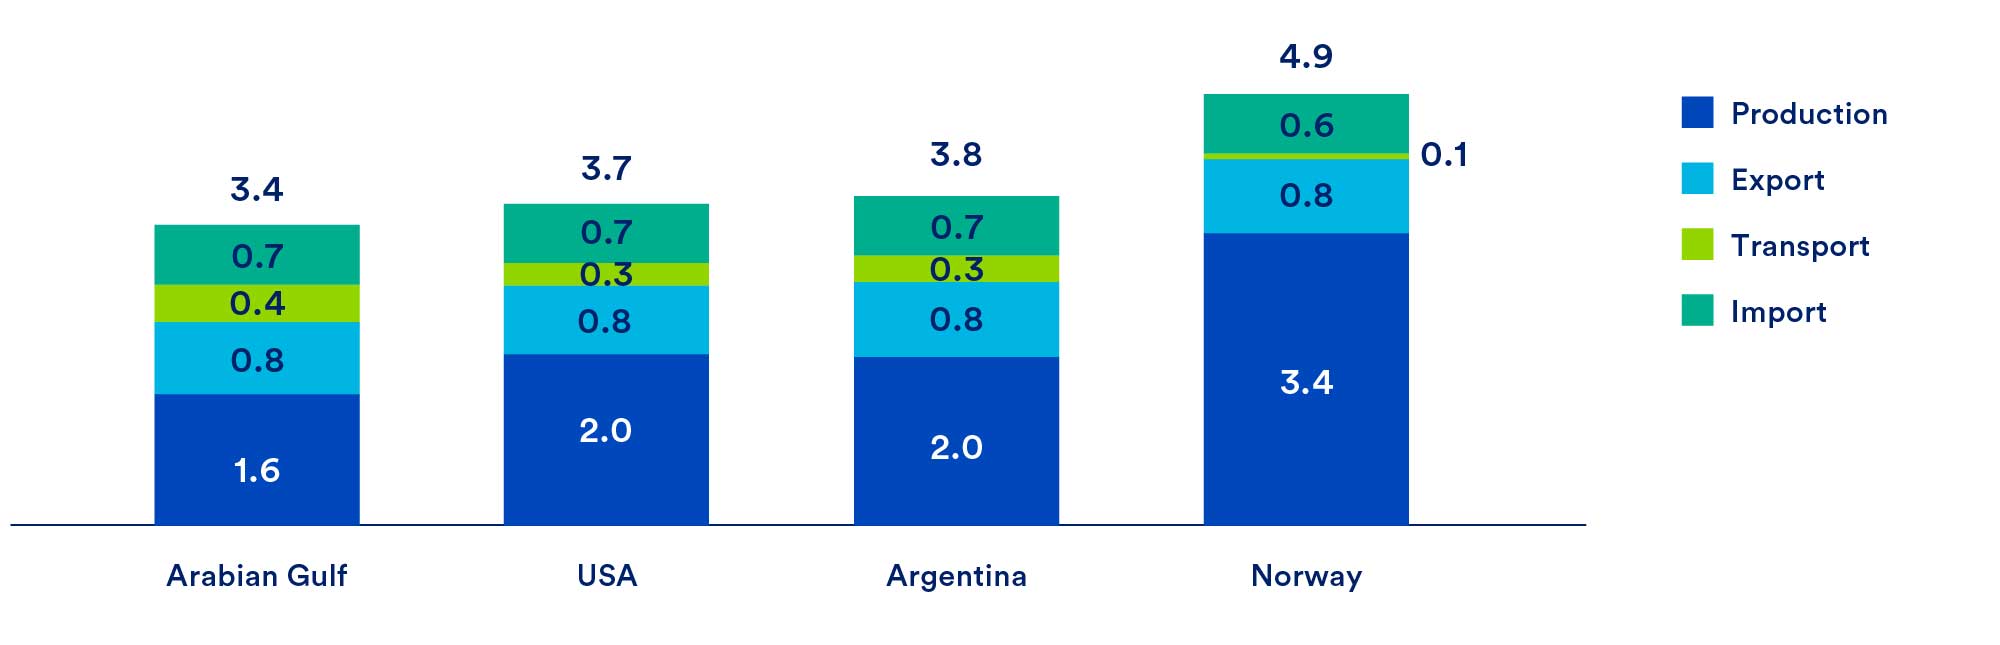
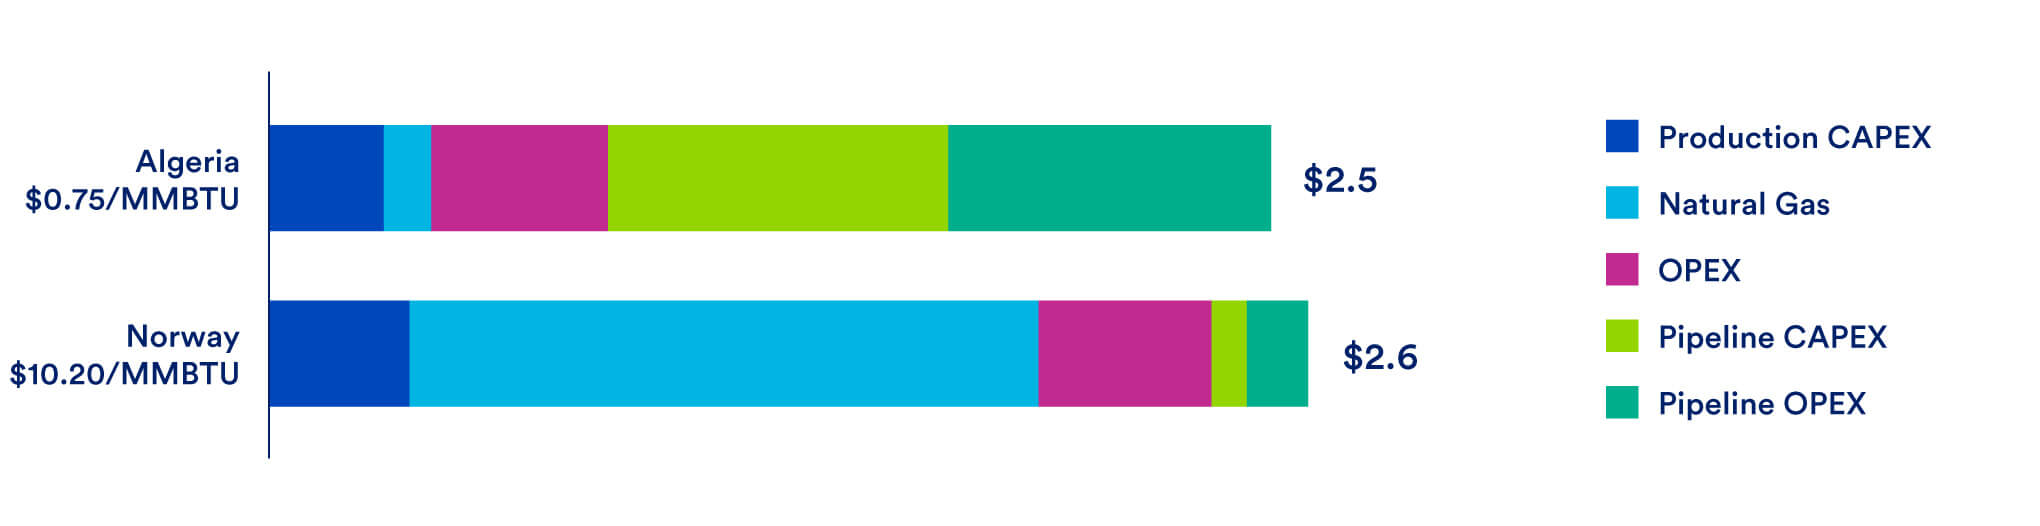
Figure 13 shows the breakdown of estimated costs for pipeline delivery of hydrogen to Rotterdam from Algeria and Norway at the (assumed) 2040 import volume of 1 million tonnes per year. Hydrogen production costs dominate for exports from Norway because of high natural gas prices. By contrast, pipeline costs dominate in the case of exports from Algeria, where natural gas prices are low. Naturally, these differences can become more pronounced as prices change, especially given a recent price surge in Dutch natural gas futures.
Figure 13: Cheapest Hydrogen Production Transported to Rotterdam via Pipeline ($/kg H2) 1 Million Tonnes Per Year H2 Supply Chain (2040)
5.3 Summary of results from the KBR cost analysis
- Three hydrogen delivery options to Rotterdam consistently ranked as the most cost-effective across all supply chain volumes: Gaseous hydrogen by pipeline from Norway and Algeria and ammonia via maritime shipping from the Arabian Gulf. These options are most cost-effective compared to all other geographies and maritime transport options including liquid organic hydrogen carriers (such as MCH) and liquid hydrogen.
- When maritime transport of hydrogen and transport via pipeline are both possible options, transporting hydrogen by pipeline consistently ranks as more cost-effective. Furthermore, it provides a simpler solution compared to the expansive maritime transport supply chain.
- Among the marine transport options considered, ammonia emerges as the lowest-cost carrier and the Arabian Gulf is the lowest-cost exporter, largely due to a combination of low natural gas prices, geographic proximity to Rotterdam and competitive construction costs.
- Estimated costs for ammonia imports from locations in North and South America are on the order of 10%–15% higher than estimated costs for ammonia imports from the Arabian Gulf (the modelled cost differential ranges from $0.20 to $0.40 per kilogram of delivered hydrogen, or $6–$12 per MWh of hydrogen, depending on overall import volume). This suggests that the United States could be a competitive supplier of low-carbon hydrogen to global markets, particularly if the price gap between U.S. and European natural gas markets continues to widen and if recently adopted U.S. policies to accelerate clean hydrogen development have the desired effect.
- Hydrogen liberation operations at the point of import are energy-intensive processes and consume a significant portion of the energy carried by the hydrogen. In the case of liquid hydrogen, hydrogen liquefaction imposes a significant energy penalty at the export location. These losses can be reduced with scale and technology improvements but will likely stay significant as they are inherent to the fundamental physics that apply to each step in the supply chain.
- Owing to economies of scale, costs per kilogram of delivered hydrogen decline with higher import volumes for all carriers and export locations.
- Natural gas prices are a major driver of hydrogen production costs, and thus of estimated costs for delivered hydrogen across all the supply chains and import pathways considered in this analysis.
- The use of uncracked ammonia rather than pure hydrogen in some applications could further reduce costs because it avoids the dehydrogenation step at the end of the value chain.
- For pipeline transport, Norway is the lowest-cost exporter at the smallest hydrogen supply volume considered (250,000 tonnes per year). At higher pipeline transport volumes, Algeria, because of its lower natural gas prices, is the lowest cost exporter.
6. Policy Context
Many governments have recognized the need for advanced technologies, including CCS and low-carbon hydrogen, to achieve decarbonization goals. The European Union’s Nationally Determined Contribution (NDC) under the Paris Agreement does not include specific plans for hydrogen use but does contemplate low- and zero-emission standards for heavy- duty transport vehicles.23 In addition, low-carbon fuels would be recognized in the context of regional trading programs that will cover electric sector emissions as well as emissions from industrial and aviation sources.
In July 2021, the European Commission issued a proposed revision of EU gas market rules, called the “Hydrogen and gas markets decarbonization package” (or “Gas package”), which outlines plans to decarbonize existing natural gas networks and regulate the nascent renewable and low-carbon hydrogen market.24 Gas market rules are currently being revised so that they align with EU plans to achieve a 55% reduction in greenhouse gas emissions by 2030.
The European Green Deal includes a hydrogen strategy and the European Commission in 2021 proposed a European Network of Network Operators for Hydrogen to ensure sound management of the EU hydrogen network and facilitate the trade and supply of hydrogen across EU borders. More recently, in May 2022, the Commission released a plan to rapidly reduce Europe’s reliance on fossil fuels from Russia and accelerate the clean energy transition. Known as REPowerEU, the plan calls for decarbonizing 30% of EU steel production using renewably generated hydrogen by 2030.25
More recently, in March 2023, the European Commission published the Net Zero Industry Act (NZIA), which aims to strengthen the global competitiveness of European manufacturers of net-zero technologies and support efforts to decarbonize hard-to-abate sectors and industries. With respect to hydrogen specifically, NZIA calls for ramping up EU electrolyzer capacity to meet the REPowerEU domestic hydrogen production goals. The Act sets an overall goal for installed electrolyzer capacity of “least 100 GW hydrogen” by 2030.
As part of NZIA, the European Union also launched a Hydrogen Bank in March 2023 to provide a mechanism for closing the hydrogen cost gap. Utilizing resources from the EU Innovation Fund (discussed in the next paragraph), it will aid the European Union in meeting
its hydrogen targets, initially by subsidizing domestic renewable hydrogen production and eventually also by reducing the cost of hydrogen imports into Europe from other regions.
The EU Innovation Fund is one of the world’s largest legislative programs to support innovative low-carbon technologies and ‘lighthouse’ projects using funds raised through the EU Emissions Trading Scheme (ETS). It provides the legal basis for the Hydrogen Bank’s budget and financial support mechanisms. A third round of 41 projects selected for funding was announced in July 2023; these projects cover decarbonization options for a range of hard-to-abate sectors (steel, biofuels, sustainable aviation fuels) and technologies, including renewable hydrogen and its derivatives.
Finally, the European Commission has proposed a system of terminology and certification for low-carbon hydrogen and low-carbon fuels that complements similar rules proposed for renewably generated hydrogen under the revised Renewable Energy Directive. An additional, encouraging development is the European Parliament’s recent push for a life-cycle based standard for hydrogen certification.26 Though not the focus of this study, progress on the issue of certification and standards is critically important, both for meeting climate goals and to address the practical demands of creating a robust global market for new low- and zero-carbon fuels. By defining and implementing standards for these fuels, Europe can shape the nascent global hydrogen market and push for increased climate ambition outside the bloc. EU Member States and international groups have made efforts to develop certification systems for hydrogen in the past, however most existing schemes are voluntary and not fit for purpose in the sense that that they do not support full emissions accounting (instead they often include only emissions from fuel production and some downstream emissions). At the same time, many European countries and companies have begun initiating memoranda of understanding (MOUs) with third countries (e.g., in the Middle East and North Africa), to import low-carbon and renewable hydrogen without any clear emissions accounting or related requirements. In setting effective standards and certification systems for new low- and zero-carbon fuels, the European Union can learn from its own past successes (such as regulating diesel sulfur) while also setting a helpful example for other countries and regions.
Around the world, the IEA’s 2022 Global Hydrogen Report reports that 26 governments have now released hydrogen strategies (up from 17 countries in 2021) and more than 20 governments have announced they are working to develop strategies. According to the Review, some 15 hydrogen projects with CCS are operational today, producing approximately 700,000 tonnes of hydrogen annually, mostly in the United States, Canada, and China; globally, another 50 projects are under development.
Among the potential export regions considered in this analysis, several countries in the Middle East and North Africa (MENA) region are interested in establishing a leadership position in both blue and green hydrogen production. A recent report from CATF details current activity in this area, including early projects by major Saudi and UAE companies to demonstrate the export supply chain for blue ammonia, as well as multiple initiatives to develop green hydrogen production capacity throughout the region. Several of the green hydrogen projects that have been announced in the Middle East and North Africa are being developed to serve the European market; most of these projects, it should be noted, are still in the agreement or planning stages and have yet to begin construction.
In the United States, the Infrastructure, Investment and Jobs Act of 2021 authorized $9.5 billion in federal funding for clean hydrogen, including $8 billion to develop regional hydrogen ‘hubs’, as well as an additional $12 billion for CO2 storage. In September 2022, the U.S. Department of Energy (DOE) released a draft National Clean Hydrogen Strategy and Roadmap that sets out three key priorities: targeting strategic, high-impact uses of hydrogen; reducing the cost of clean hydrogen to $1/kg by 2031; and deploying at least four regional clean hydrogen hubs.27 (The $1/kg cost target was first announced in 2021 as part of DOE’s Hydrogen Earthshot initiative.) More recent legislation, the Inflation Reduction Act of 2022, contains additional provisions designed to subsidize clean hydrogen production, including a new, 10-year hydrogen production tax credit28 and an increase in the existing (Section 45Q) tax credit for carbon capture and sequestration. Since this analysis was conducted prior to the passage of the Inflation Reduction Act, KBR’s cost estimates do not account for the impact of these provisions. But it is worth noting that recently adopted U.S. tax policies, by reducing the cost of producing clean hydrogen in the United States, could also make the United States a more appealing supplier to future global markets for low-emissions hydrogen and ammonia.
7. Policy Recommendations and Areas for Further Research
As described in the previous section, two of the world’s largest energy markets have recently announced major policy initiatives aimed at supporting clean hydrogen: the European Union with its Green Deal and related policies, as well as REPowerEU, and the United States with the Infrastructure, Investment and Jobs Act and Inflation Reduction Act. Myriad recent announcements and memoranda of understanding concerning new hydrogen projects are a strong testament to the appetite of countries and investors for developing clean hydrogen technologies. High cost, however, remains a significant barrier to the realization of these projects and to the adoption of hydrogen in sectors that could benefit from the deployment of climate-friendly fuels.
Various mechanisms have been proposed to help overcome these cost barriers. For example, national governments (or other public bodies) could offer long- term contracts to pay the difference between a pre- defined reference price for a desired product (such as low-carbon hydrogen or a ton of avoided CO2 emissions) and a strike price required for the new technology to be commercially viable. Known as “contracts for difference” (CfDs) or “carbon contracts for difference” (CCfDs), the idea is to provide long-term price certainty — in effect, transferring price risk to a public counterparty — as a way to incentivize private investment and thereby kick-start the development of new technologies.
These and other strategies for supporting zero-carbon fuels are currently under discussion by the European Commission.29 More broadly, developing and scaling supply chains for clean hydrogen will require major investments and supportive policies in both consuming and producing countries.30 Other CATF reports have identified several priority areas for further policy action31 and have underscored the need for coordinated, deliberate efforts by multiple stakeholders to develop markets for low-carbon hydrogen in those applications where it makes sense. Concerted policy interventions will also be needed to responsibly advance carbon management projects in hydrogen producing regions and to de-risk the build-out of new infrastructure for CO2 transport and geologic sequestration. Other types of policies, such as fuel-neutral government procurement policies for low- and zero-carbon fuels can be effective in stimulating markets for an array of decarbonization options, including clean hydrogen.
Challenges for Scaling Domestic Production of Clean Hydrogen in Europe
As noted in previous sections, European demand for clean hydrogen is expected to increase dramatically in coming decades, from 280 TWh today to more than 2,000 TWh by 2050 according to some estimates. Accordingly, the REPowerEU Plan puts near-term pressure on EU Member States to rapidly scale hydrogen production and import capacity, including a commitment to collectively produce — by 2030 — up to 10 million tonnes per year of domestic hydrogen and import a further 10 million tonnes per year from other regions.
To put this target in perspective, meeting just 80% of the European Commission’s target for domestic production of renewable ‘green’ hydrogen (i.e., 8 million tonnes per year) would consume roughly half of all the additional electricity output planned to come from renewable energy sources between 2022 and 2027 — or the equivalent of approximately 15% of total electricity demand in Europe today.
Given the significant, multi-faceted challenges inherent in a scaleup of renewable power generation of this magnitude, European governments and policymakers must think realistically about viable domestic production and import pathways for hydrogen and take an approach that is open to different technology options based on their merits in terms of emissions reductions, technical feasibility, and cost-effectiveness.
The findings from this study underscore the numerous hurdles to transporting hydrogen by sea, which include, but are not limited to, the inherent energy requirements (and potential emissions implications) of associated processes. Recognizing these hurdles, CATF concurs with the overall conclusion reached by a recent European Commission study, which found that most of the hydrogen needed to meet future European demand will likely be either (a) produced near the point of end-use or (b) imported by pipeline.32 Additional high-level conclusions and policy recommendations from this analysis are summarized below:
- Plans for hydrogen deployment should focus on “no-regrets” sectors, where other energy-efficient or cost-effective decarbonization options are currently lacking. Examples include current uses of hydrogen as a chemical feedstock in the refining and chemical sectors in addition to future potential uses in the steel sector. A clear understanding of (a) how much hydrogen priority sectors such as fertilizer production, refining, and heavy-duty transportation will need and (b) how much low-carbon hydrogen Europe can produce domestically and how much, realistically, can be imported, is critical to developing effective and ultimately successful policies for expanding hydrogen use in those applications where it makes sense.
- Hydrogen demand forecasts should be re-examined to develop more realistic estimates. At present, some prominent policy targets, such as the European Commission’s goal of supplying the European market with 20 million tons per year of clean hydrogen by 2030,33 seem to lack a clear basis. Realistic projections, grounded in thoughtful analysis, are critical to designing effective and ultimately successful policies. Moreover, by focusing on this very near-term goal, European governments risk missing opportunities to integrate the broader set of climate-friendly technologies that will be needed to achieve net zero by midcentury. Failure to support this integration together with the timely development and commercialization of needed innovations could mean that the bloc finds itself in 2040 still short of meeting its 2050 goals, and with not enough time to deploy the technologies that will be needed to close the gap.
- An internationally recognized system for hydrogen certification is urgently needed. Although several international groups and national governments are working to develop methodologies for certifying clean hydrogen and ammonia, the lack of clear standards and an internationally recognized certification system remains an important barrier to investment in nascent hydrogen markets. A robust hydrogen certification system should be based on rigorous analysis of lifecycle greenhouse gas emissions across the entire value chain, including fugitive upstream methane emissions for hydrogen production from natural gas and manufacturing and construction emissions associated with primary energy inputs to the hydrogen production process. Analysis across the entire hydrogen value chain and clarity about certification standards and requirements are crucial to create market confidence and minimize investment risks. Providing this clarity is an opportunity for EU policymakers and Member States to help drive the emergence of a global market for climate-beneficial hydrogen, foster the alignment of certification systems internationally, and set the tone for trade, thereby fostering an environment that is suitable for realizing the projects and investments needed to meet future European and global hydrogen demand.
- Further work is needed to identify what part of Europe’s expected hydrogen demand could be met by uncracked ammonia and to spur development of related technologies and infrastructure.
- Further work is needed to understand the infrastructure needs and costs associated with building out storage and distribution systems for delivering hydrogen to end users. Whether clean hydrogen is produced in Europe or imported, it will have to be delivered in a reliable and cost-effective manner to end users. Associated ‘last-mile’ costs and challenges, while not the focus of this study, are potentially significant and merit attention from policymakers.
- Public policies and resources should be leveraged to prioritize the most promising and cost-effective technologies first, recognizing that, while option value is important, so is avoiding expensive investments in infrastructure that is inherently inefficient or unlikely to be used. The reality is that additional technologies and a deeper paradigm change will be needed to achieve net zero greenhouse gas emissions in Europe and elsewhere — current policies are not enough. Thoughtful assessment of the full range of strategies that could be available to reduce greenhouse gas emissions, including options for sectors such as power, district heating, and light-duty vehicles that are more climate-beneficial and less costly than hydrogen, will significantly reduce the risk, both of missing the European Union’s climate and emissions targets and of creating stranded assets through the misallocation of public funds.
The comparative cost analysis described in this report highlights some of the significant challenges and large uncertainties that apply to current plans for large-scale hydrogen development. It also suggests several priority areas for further study, for example:
- Developing a better understanding of ‘last-mile’ costs to deliver hydrogen to end users.
- Exploring potential uses of uncracked ammonia in industry to further reduce costs.
- Evaluating the climate impacts of ammonia, going beyond economic costs.
- Understanding competing demands for ammonia from the agricultural industry.
- Exploring the potential to use imported LNG for low- carbon hydrogen production closer to likely end-users. This could be particularly relevant for Europe, given recent efforts to increase LNG import capacity following the disruption to European gas markets in early 2022.
Further study in these and other areas would help governments and stakeholders identify the most important hurdles to developing cost-effective supply chains for clean hydrogen; provide a clearer sense of the overall role clean hydrogen can play in future decarbonization efforts; and help policy makers design more effective strategies for incentivizing needed technology and infrastructure investments.
Acronyms and Chemical Formulas
ATR: auto thermal reforming
CATF: Clean Air Task Force
CCS: carbon capture and storage
CCfD: carbon contract for difference
CfD: contract for difference
CH4: methane
CO2: carbon dioxide
°C: degrees celsius
DOE: U.S. Department of Energy
H2: hydrogen
IEA: International Energy Agency
kg: kilogram
LCOH: levelized cost of hydrogen
LH2: liquid hydrogen
LNG: liquefied natural gas
LOHC: liquid organic hydrogen carrier
MCH: methylcyclohexane
MENA: Middle East and North Africa
SMR: steam methane reforming
Footnotes
The Port of Rotterdam was chosen because it is a significant economic driver in Europe, a major bunkering hub, and adjacent to numerous heavy industrial facilities that can potentially use imported hydrogen. In addition, the Rotterdam port operator has announced plans to develop capacity to handle 20 million tonnes per year of hydrogen imports by 2050. These plans reflect, in part, the European Union’s adoption of strong decarbonization goals that are widely expected to increase European demand for hydrogen. Of note, operators at several other European ports, including the ports of Antwerp-Bruges and Wilhelmshaven, are also looking at hydrogen imports as part of their energy transition plans.
CATF has explored potential pricing regimes for low-carbon hydrogen in the early stages of a developing market. See: https://www.catf.us/2022/10/potential-pricing-regimes-global-low-carbon-hydrogen-market/
We assume ‘blue hydrogen’ production from natural gas with carbon capture for this analysis because the technologies involved are more mature and less costly—and can therefore be scaled more rapidly—than ‘green hydrogen’ production from renewably powered electrolysis. It should be noted, however, that KBR’s cost estimates for the transport and import segments of the value chain apply regardless of the production method used to make hydrogen in the exporting region.
For most of the marine import pathways considered, KBR assumes self-consumption of a portion of the hydrogen cargo by the transport vessel during shipping. In the case where hydrogen is transported in the form of methylcyclohexane (MCH), KBR assumes that transport vessels operate on liquefied natural gas (LNG) as the bunkering fuel.
The full KBR report and analysis can be accessed here.
There have been previous waves of interest in hydrogen, including in the 1970s, 1990s, and early 2000s. Most of the focus in these earlier periods was on potential applications as a transportation fuel, however, and enthusiasm waned when oil prices fell or, in the case of the 2000s, when gains in battery technology favored electric vehicles over hydrogen fuel cell vehicles.
For more information about decarbonization challenges in certain leading industries and about the importance of industrial decarbonization in Europe specifically, see: https://www.catf.us/2021/10/industrial-decarbonisation-europe-analysis/
Throughout this report, quantities of hydrogen are given in units of mass, specifically kilograms (kg) or tonnes (metric tons) and in some cases also in terms of equivalent energy content (in units of megawatt-hours). One megawatt-hour (MWh) corresponds to the energy content of approximately 30 kg of hydrogen. One tonne (or metric ton) is equal to 1,000 kilograms.
- https://www.iea.org/reports/global-hydrogen-review-2022/executive-summary
- https://iea.blob.core.windows.net/assets/c5bc75b1-9e4d-460d-9056-6e8e626a11c4/GlobalHydrogenReview2022.pdf
- https://www.iea.org/fuels-and-technologies/hydrogen
Electrolysis using renewably generated electricity accounts for an even smaller share of global hydrogen production at present: on the order of one-tenth of percent according to the IEA (see: https://www.iea.org/reports/the-future-of-hydrogen).
- https://www.iea.org/reports/global-hydrogen-review-2021/executive-summary. Data for 2022 are not available but the worldwide increase in energy prices over the last year has almost certainly led to higher prices for hydrogen as well.
Although hydrogen is more energy dense than conventional fossil fuels on a mass basis, it is far less dense on a volume basis.
A further point is that neither liquefaction nor conversion to another liquid chemical carrier fully overcomes hydrogen’s disadvantages, in terms of low volumetric energy density, relative to conventional fossil fuels. For example, liquified hydrogen has only 40% the energy of an equivalent volume of liquified natural gas (LNG); in addition, liquified hydrogen needs to be maintained at a significantly lower temperature (-253 degrees Celsius versus -162 degrees Celsius for LNG). Some analysts argue that these inherent disadvantages will significantly constrain the real-world potential for large-scale use of hydrogen as a low-carbon fuel alternative.
Because of the very low density of gaseous hydrogen, it generally would not be cost-effective to transport large quantities of gaseous hydrogen over long distances by ship or truck — for this reason, we consider pipelines as the only mode of transport for imports of gaseous hydrogen.
The analysis accounts for the need to place compression stations along pipeline routes (at intervals of approximately 100 kilometers); it assumes that these stations are powered by electricity and includes associated electricity costs in pipeline operating expenditures (see further discussion in Section 4).
Contingency costs are financing costs during construction.
Where liquid hydrogen or ammonia are being transported, the analysis assumes that these hydrogen carriers also serve as the marine bunker fuel for the transport vessel. See further discussion in Section 4.2).
The full KBR report does include some simple estimates of CO2 emissions for different hydrogen import pathways. These are driven by the small fraction of CO2 emissions (on the order of 3%) that are not captured at the hydrogen generation plant and, in the case of the MCH carrier pathway, by the use of LNG as a bunker fuel during marine transport. Because the underlying calculations are highly simplified and subject to large uncertainties, and because emissions were not intended to be a focus of the analysis, we do not include KBR’s CO2 results in this summary.
The EPA analysis was conducted as part of the development of a CO2 emission standard for the U.S. electric power sector. See: https://www.epa.gov/stationary-sources-air-pollution/greenhouse-gas-standards-and-guidelines-fossil-fuel-fired-power
There are no large-capacity vessels capable of transporting liquid hydrogen in service at presence. The only existing H2 transport ship, the Suiso Frontier, is a demonstration vessel and can transport no more than 90 tons (1250 m3) of liquid hydrogen.
- https://energy.ec.europa.eu/topics/markets-and-consumers/market-legislation/hydrogen-and-decarbonised-gas-market-package_en
- https://commission.europa.eu/strategy-and-policy/priorities-2019-2024/european-green-deal/repowereu-affordable-secure-and-sustainable-energy-europe_en
For a recent CATF press release on the European Parliament’s recent action, see: https://www.catf.us/2023/02/european-parliament-pushes-for-life-cycle-analysis-backed-standard-for-hydrogen-and-ammonia/. Additional information on how the European Union can certify low-carbon hydrogen and on assessing full lifecycle greenhouse gas emissions from hydrogen production and use is available from several CATF blog posts. See: https://www.catf.us/2022/07/how-eu-can-certify-low-carbon-hydrogen/ and https://www.catf.us/2022/10/hydrogen-lca-emissions-across-life-cycle/.
For more information about regional clean hydrogen hubs, including CATF recommendations for ensuring that these hubs are clean, equitable, and sustainable, see: https://www.catf.us/2022/06/what-makes-good-clean-hydrogen-hub/
The new Section 45V production tax credit introduced by the Inflation Reduction Act (IRA) ranges from $0.60 to as much as $3.00 per kilogram of hydrogen, depending on lifecycle emissions associated with the mode of hydrogen production used. To qualify for the Section 45V tax credit, the carbon intensity of hydrogen production must be no more than 4 kg CO2e per kg of H2. (The maximum tax credit of $3.00 is available only to hydrogen produced with a carbon intensity below 0.45 kg CO2e per kg H2.) The IRA also increased the existing Section 45Q tax credit for CCS to $85/tonne CO2 captured. This credit could be available to firms that use fossil-fuel-based methods to produce hydrogen, together with CCS systems to offset associated CO2 emissions. Note that the Section 45Q and 45V tax credits cannot be combined, so hydrogen producers must choose one if they qualify for both.
Specifically, the European Commission is discussing implementing competitive bidding mechanisms for CfDs, CCfDs, and other comparable instruments through the Innovation Fund, which is financed by revenues from allowance sales under the EU emissions trading system and is the world’s largest funding program for low-carbon technologies. The Commission is considering implementing CfDs for domestic hydrogen purchased with guarantees from the new European hydrogen bank announced by Commission president, Ursula von der Leyen, in September 2022.
For example, CATF’s report on clean hydrogen production opportunities in the Middle East and North Africa (MENA) region, calls for MENA countries to step up regional coordination, collaborate on technical pilots, develop comprehensive domestic policy frameworks to support low- and zero-carbon fuels, advocate for international financial institutions and donor governments to include hydrocarbon-derived zero- carbon fuels in their investment portfolios, build capacity within government agencies, and educate private lenders and investors about advanced energy and climate technologies. The report, titled Poised to Lead: How the Middle East and North Africa Can Accelerate the Global Energy Transition, can be accessed at https://cdn.catf.us/wp-content/uploads/2022/05/23114054/poised-to-lead-middle-east-north-africa-accelerate-global-energy-transition.pdf
Another recent study from the European Commission, by Fraunhofer et al., reaches a similar conclusion about the likelihood of a relatively smaller role for hydrogen imports to Europe.
Hydrogen (europa.eu)
Credits
Marika Tatsutani, Consultant and Technical Writer
Ghassan Wakim, Production and Export Director, Zero-Carbon Fuels, CATF
Magnolia Tovar, Global Director, Zero-Carbon Fuels, CATF
Alex Carr, Zero-Carbon Fuels Program Manager, CATF
Hagan Han, Zero-Carbon Fuels Associate, CATF
Featured in the Media
‘Don’t crack imported blue ammonia back into hydrogen — it raises costs by 50%’: study | Hydrogen Insight
Domestic generation and pipelines make H2 cheaper | Tagesspiegel Background

