

Forecast with caution: Decarbonized electricity cost projections vs reality – an offshore wind case study


Forecasts1 play a crucial role in energy and decarbonization policy and investment planning. These forecasts need to accurately account for uncertainties such as market volatility, supply chain constraints, land limitations, macroeconomic challenges, and high manufacturing costs. Both potential cost increases and decreases must be considered.
While historical and current high costs are not a predictor of future costs, we argue that decisionmakers should not exclusively rely upon singular optimistic cost projections either. Instead, decisionmakers should explore the implications of limited cost declines or moderate increases, especially regarding climate targets. This will help ensure robust strategies under different futures. The energy sector has witnessed unexpected outcomes like failed procurements and cancellations in offshore wind projects in the UK and the U.S. due to rigid adherence to specific forecasts and deterministic narratives. Moderate cost increases are being observed in solar and onshore wind projects as well, underscoring the importance of continuous industry trend monitoring and risk assessment on the path to a decarbonized economy. Similar care should be applied to cost projections for other decarbonizing technologies such as carbon capture and storage (CCS), hydrogen of all colors, and nuclear energy.
To avoid overconfidence in forecasts and vulnerabilities in our planning, we need to:
- Acknowledge that all cost projections come with inherent technical limitations and are not meant to predict the future;
- Conduct sensitivity analysis around key cost parameters in modeling2 and analysis informing policy and decision making; and
- Use probabilistic distributions to capture the uncertainty and variability in cost assumptions.
In this blog, we use the example of offshore wind to illustrate these points.
Rising costs lead to stalled progress
Economy-wide decarbonization is dependent on the cost of low-carbon energy3 falling continuously, as well as effective policy mechanisms to incentivize deployment of the technologies and infrastructure needed to operate a large-scale low-carbon grid. Put simply, cheap, clean, abundant, and reliable electricity is at the heart of any decarbonization plan.
Europe’s 2030 climate targets are looming, but progress on decarbonizing the energy sector has stalled with recent low-carbon electricity support auctions procuring less capacity than expected and project cancellations due to unanticipated cost rises. Therefore, there is concern that the progress Europe has achieved since 1990 could be slowing just as the pace of decarbonization needs to ratchet up. Despite this, forecasts predict a smooth and swift reduction in renewable project costs, with recent costs increases being nothing more than a footnote.
The gap between projections and reality introduces significant risks to planning a cost-effective decarbonized system. A realistic portrayal of potential future costs is necessary to navigate these risks effectively. Additionally, changes to cost forecasts can result in significantly different optimal technology portfolios, and different portfolios may be more resilient to forecast errors.
So why are modeled cost projections so different from what is playing out in the market? Let’s take a closer look.
Existing forecasts are not robust against real-world challenges
Most projections4 of wind and solar economics assume year-over-year cost reductions. The decrease in costs result from presumed technology learnings and economies of scale benefits associated with increased deployment. For example, Figure 1 shows a historical industry benchmark until 2023 then followed by a typical electricity cost projection up to 2030.
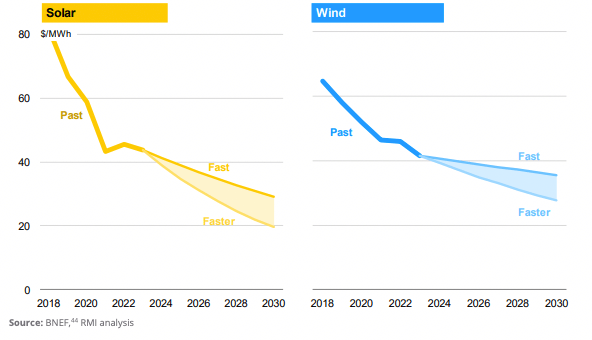
A closer look at the recent renewable electricity markets, however, reveals the chasm between these declining cost projections and the economic reality of new generation projects.
For example, the UK has been employing a Contracts for Difference (CfD) procurement scheme since 2014 to incentivise renewable energy investments, which resulted in successful deployment of renewable energy technologies to date and reduced clearing prices over time. The purpose of the CfD policy is to close the gap between the revenue needs of a project and the uncertain forecasted power prices, thereby minimizing risks to developers. The strike price of the CfD is set by the government and reflects the maximum price per MWh it agrees to pay for procuring clean energy. This is done by developing a range of technology-specific cost forecasts and using it to set the strike price at a precisely correct level. There is a delicate balance to be struck – too low strike price won’t entice investors to put their capital at risk, but too high strike price is an unnecessary burden on the taxpayer bill, while developers profit.
This means that inaccurate forecasts can hamper development of low-carbon technologies. This is exactly what happened in the latest UK auction in September 2023 (known as Allocation Round 5 or “AR5”), which failed to attract a single offshore wind developer. In other words, the presumed strike price for offshore wind in AR5 was lower than what developers deemed sufficient to offset the reality of escalating project costs, and therefore did not incentivize any new offshore wind project investments.
Once CfD is secured by a developer, actual project costs typically fluctuate from original expectations due to economic realities, but, unfortunately for the developer (and the public who ultimately is affected), the clearing price remains the same as that set in the allocation round. Over time, that can create disparities in costs and revenues that puts clean energy projects at risk of not being delivered. This is the main reason why offshore wind projects which secured CfDs in the previous auction at a very low clearing price are having difficulties remaining profitable or even feasible.
In July 2023, Vattenfall openly pulled out of their contract secured in the Allocation Round 4 to deliver 1.4 GW of offshore wind, quoting 40% costs increase, while others, such as Ørsted, voiced similar cost concerns and called for support from the government.
This lack of new project investment from AR5, and precarious state of projects from AR4 is a real concern, considering the UK’s lofty 2030 capacity targets for offshore wind. If the UK is to reach its target, swift course correction is needed to repair the damage done by unachievable strike prices and to ensure future strike prices are based on realistic market conditions.
This issue is not unique to the UK. In the U.S. market, Ørsted recently announced it is pulling out of its Ocean Wind 1 and Ocean Wind 2 projects off the coast of New Jersey after related impairments had surged above $5 billion. In 2022, AVANGRID terminated its power purchase agreement (PPA) for a 1.2 GW offshore wind project off Massachusetts, agreeing to pay $48 million in penalties rather than deliver on the project. Similarly, BP and Equinor applied to renegotiate their PPAs for 3.3GW across several projects to reflect the reality of escalating costs versus previous projections. The plea was now rejected by the New York State Public Service Commission (PSC) potentially putting those projects at risk.
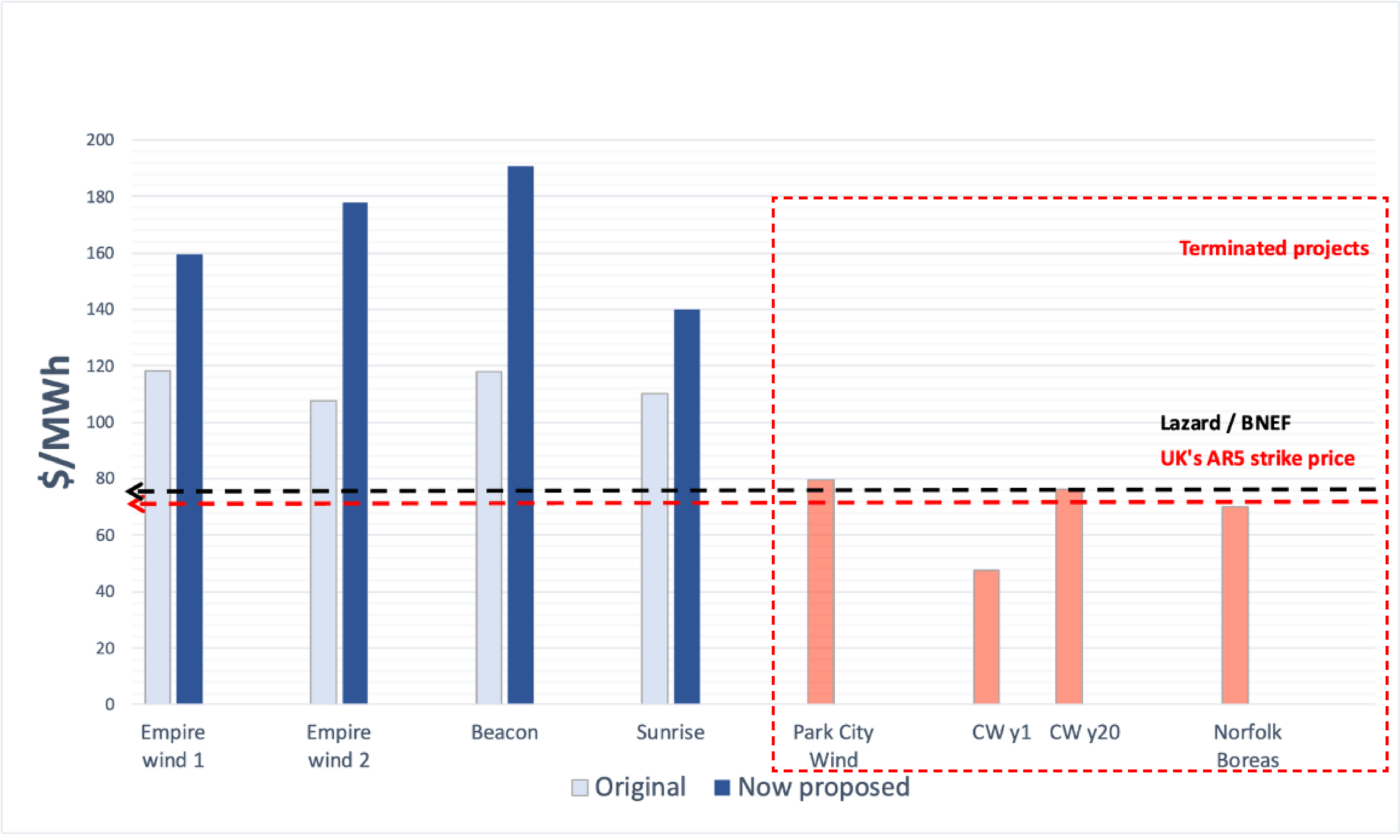
The projects shown in Figure 2 are future projects to be operational within a few years. According to the theory of learning rates, on average the costs of future projects should be lower than the projects commissioned in recent years (varying within reason across regions and on a project-to-project basis). In reality, we observe an opposite trend of increasing costs and failing projects – a trend that current forecasts5 fail to acknowledge.
Since early 2021, prices of raw materials and freight have significantly risen. From January 2020 to April 2023, PV-grade polysilicon costs quadrupled and peaked in August 2022, U.S. steel prices increased by 140%, copper by 65%, and aluminum by 80%, with freight costs nearly quintupling. Despite a recent decline, these costs remain above early 2020 levels.
Delivered energy costs are also influenced by macroeconomic risks in the global economy, resulting in increased labor costs, inflation, and elevated interest rates. These risks are driven by a variety of factors, including supply chain constraints during the pandemic, responses to economic stimulus spending, and geopolitical events like Russia’s incursion into Ukraine. Consequently, these factors contribute to elevated costs of capital, labor, and materials for energy projects.
These impacts result in a departure from the longstanding forecasted trend of decreasing costs and have resulted in higher prices for wind turbines and PV modules as manufacturers pass on the added equipment expenses to consumers. In comparison to 2020, it is estimated that the overall investment costs for new utility-scale PV and onshore wind projects have increased by 15% to 25% in 2022.
The IEA anticipates rising costs of capital in major solar and wind markets, except China, due to inflation adjustments. Some experts foresee higher future interest rates driven by global demographic and economic shifts. Ongoing supply chain challenges in the decarbonization push may offset cost savings from lower commodity prices and technological advances. Consequently, the IEA expects the average Levelized Cost of Electricity (LCOE) for large-scale PV and wind projects to increase by 10-15% by 2024 compared to 2020.
Past project data do not match smooth forecast curves
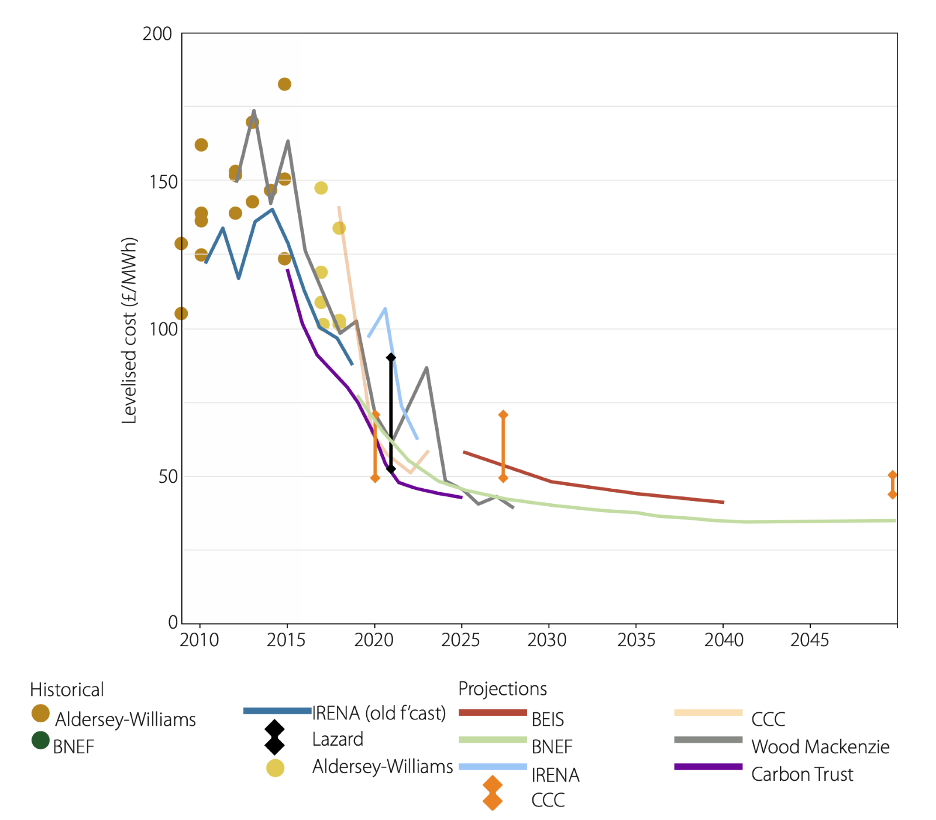
Another reason to question projections for ever-decreasing costs comes from examining the two decades of available real project data and comparing them to forecasts (Figure 4).
Let’s consider offshore wind in the UK once again. The market for this technology is now well established with 44 offshore wind farms operating across the UK and another eight under construction as of June 2023. As such, this existing fleet offers an opportunity to examine the actual spend reported by the developers in their financial reports.
In Figure 3, we compare historic accounts of costs from a Wind Power Economics study6 with the announced pipeline of projects and selected industry forecasts until 2040. One can observe a large variation in project capital costs on a £m per MW basis, which is to be expected as project costs will vary significantly due to a number of site-specific factors, and no clear trend emerges in the 2010 to 2020 period.7 Similarly, the historic reported levelized cost data shown in Figure 4 exhibit a large variation for the same reason.
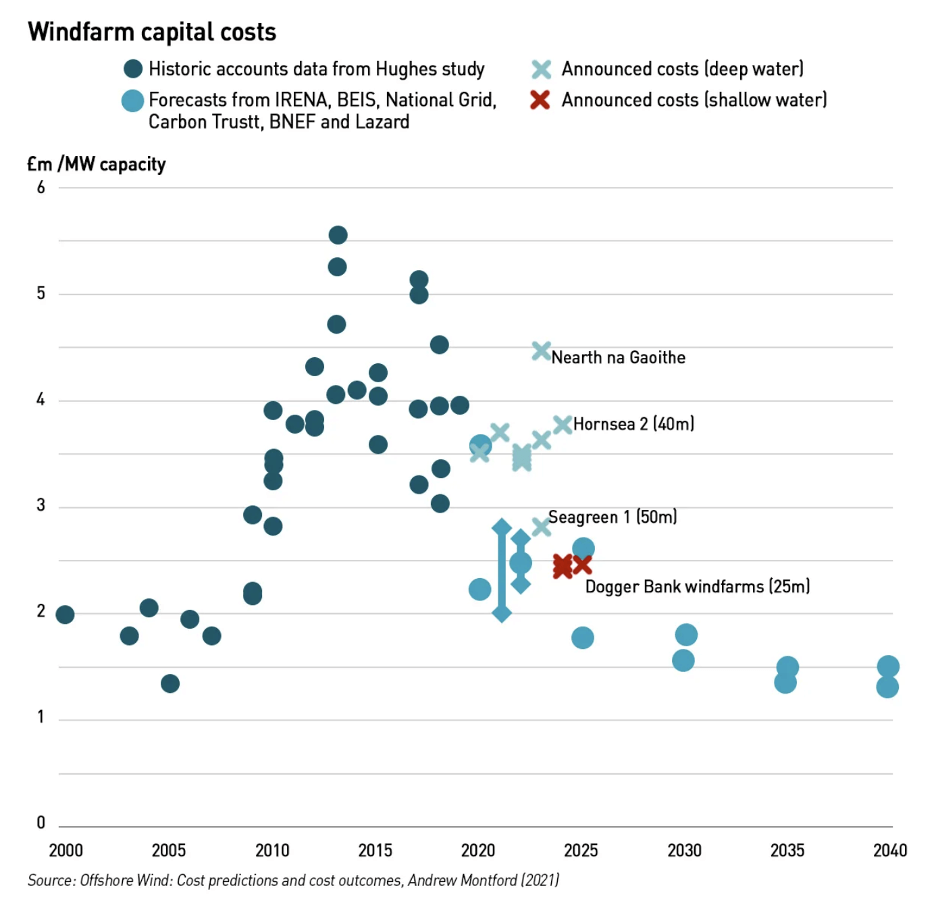
The scattered historical data reflects the intrinsic complexity of estimating future site-specific offshore wind costs in a dynamic and uncertain economic environment.
Forecasts do not capture future system-specific impacts on delivered costs
Besides historical cost variability, simplified forecasts overlook crucial uncertainties in estimating actual technology costs.
First, early projects are developed on the best available land or seabed, i.e., at the lowest cost, closest to existing transmission, and in areas with consistently high wind speeds, shallow waters, minimal public opposition. However, as these prime sites get used up, future developments will have less ideal conditions, potentially leading to delays and increased project costs. These factors have already caused a slow-down in deployment across many jurisdictions. Additionally, challenges related to critical minerals and supply chains are emerging.
Second, historical project costs may not account for true delivered costs; a study exploring net profits of wind turbine manufacturers found increasing reported net losses since 2018 (Figure 5). This implies turbines are being sold at a discount, thereby deflating the true project costs.
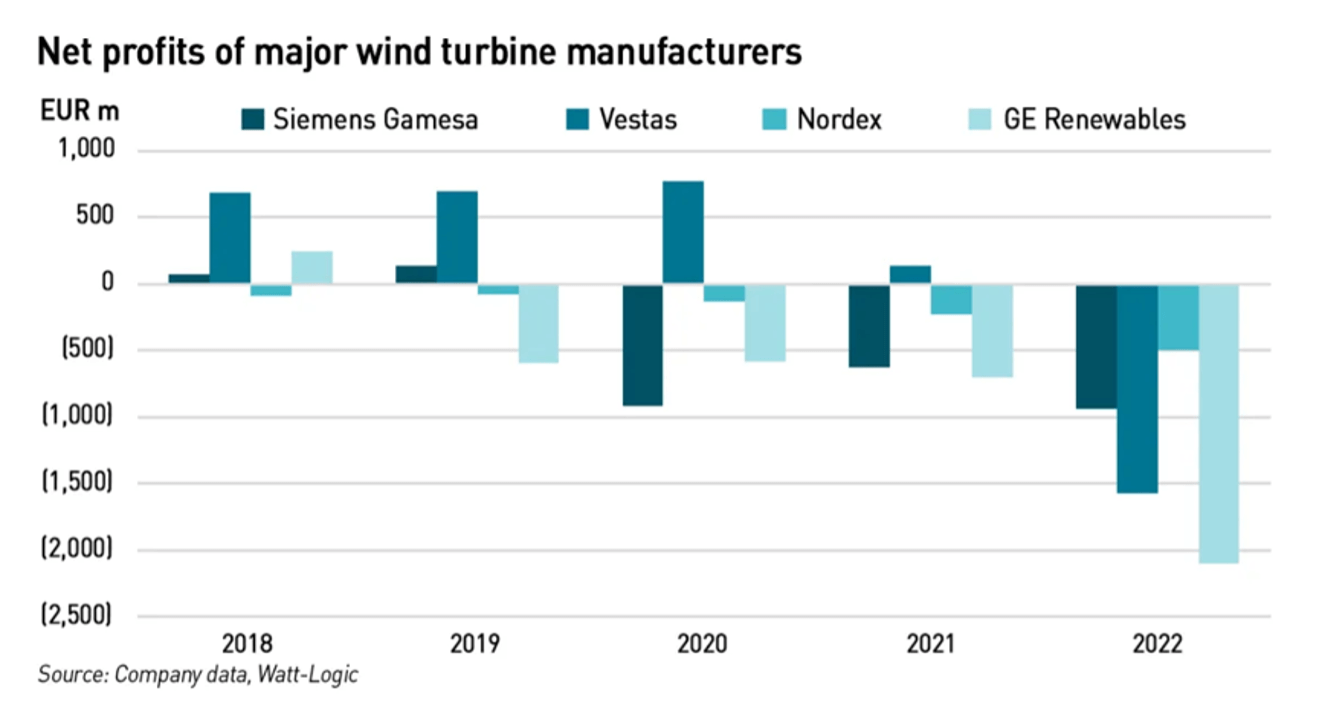
The increasing number of wind turbine manufacturers reporting losses suggests a broader issue of declining profitability in the wind energy sector. A notable example is the Markbygden EET wind farm in Sweden, Europe’s largest onshore wind farm, which recently filed for bankruptcy and restructuring. This farm had a unique power purchase agreement (PPA) with Norwegian Hydro Energi, requiring it to compensate for its inconsistent energy production. Essentially, the farm had to purchase additional electricity from the spot market whenever its own generation was insufficient. This arrangement made the farm vulnerable to higher electricity prices,8 especially during periods when its turbines were inactive or unable to meet the demands of the PPA.
Moving forward: Forecast with caution
While historical and current high costs are not a predictor of future costs, we argue that we should not exclusively rely upon singular optimistic cost projections either. Instead, we should investigate the impact of plausible limited cost declines or even moderate cost increases on the planned expansion on offshore wind in the near term especially in relation to achieving climate targets to ensure our strategies are robust under different futures.
A rigid adherence to specific forecasts and an overconfident narrative perpetuated across the industry has led to unexpected outcomes such as failed procurements and cancellations of offshore wind in the UK and the U.S. And these findings are not limited to the offshore wind sector. Moderate cost increases are being observed in solar and onshore wind projects as well, signaling the importance of closely following industry trends, and continuous assessment of risks and uncertainties on the path to a decarbonized economy.
To avoid overconfidence in forecasts and vulnerabilities in planning, we need to:
- Acknowledge that all cost projections come with inherent technical limitations and are not meant to predict the future;
- Conduct sensitivity analysis around key cost parameters in modeling9 and analysis informing policy and decision making; and
- Use probabilistic distributions to capture the uncertainty and variability in cost assumptions.
UK officials have now attempted to remedy their original error and make the necessary adjustments by increasing the CfD strike price for offshore wind of next year’s auction from original £44/MWh up to £73/MWh, raising it by a total of 66%. The floating offshore strike price was also increased from £116/MWh to £175/MWh to reflect new market conditions. This change will hopefully address the original disconnect between previous costs assumptions and the actual costs of new offshore wind projects in the UK and thus will result in bringing forward new capacity in the upcoming AR7. Nevertheless, a year has been lost due to incorrect market assumptions which reduced investor confidence in the UKs offshore wind and put climate targets in jeopardy.
Our decarbonization goals include very ambitious deployment targets with little time to correct for missteps in market interventions rooted in deterministic cost assumptions, based on past performance and presumed learning curves. Instead, we need a dynamic, iterative process that simultaneously looks behind us, around us, and ahead of us to robustly capture both the uncertainty and variability in underlying market mechanisms.
1 Forecasting is a technique that uses historical data as inputs to make informed estimates that are predictive in determining the direction of future trends (Investopedia).
2 Energy systems modelling is the process of creating simulations of energy systems, including the sources, pathways, and end uses of energy. This can include models of individual components, such as power plants or electric vehicles, as well as models of entire energy systems, such as a national electricity grid or a city’s transportation system (Imperial College of London).
3 Variable renewable generators and clean firm generators alike.
4 Some examples include McKinsey, Wood MacKenzie, UKs Department for Energy Security and Net Zero.
5 Such as RMI forecast mentioned before.
6 The study is based of data derived from an earlier peer reviewed study by J. Aldersey-Williams followed by a policy perspective to address misreporting of the original article.
7 Authors would like to highlight that we do not attempt to predict future cost trends based on historic data referenced in this blog.
8 Higher pricing is caused by the fact that the wind generation is often regionally correlated which in effect suppresses the electricity prices when abundant near zero marginal cost electricity floods the market. This is known as a cannibalisation effect. When wind is not blowing, there is less generation on the market causing electricity prices to rise.
9 Energy systems modelling is the process of creating simulations of energy systems, including the sources, pathways, and end uses of energy. This can include models of individual components, such as power plants or electric vehicles, as well as models of entire energy systems, such as a national electricity grid or a city’s transportation system (Imperial College of London).

