
Designing a €100bn Industrial Decarbonisation Bank to Deliver Operating Projects

Key Recommendations
The Industrial Decarbonisation Bank will be essential to enabling industrial decarbonisation at scale, but it must be designed to convert funding commitments into operating projects. CATF recommends that the IDB is designed as a coordinated system: competitive carbon contracts for difference (CCfDs), project development support, and targeted support for shared enabling infrastructure. These should be sequenced so that development support and infrastructure selection precede or run in parallel with the CCfD round. The IDB should be designed around the following principles:
Allocate funding through a competitive, technology-neutral instrument
- Award CCfDs through a single technology-neutral auction, ranking bids on cost per tonne of CO₂ avoided across all eligible pathways.
- Apply a per-sector cap, sized by EU ETS emissions. Open an additional pool that capped sectors can draw on, so lower-cost projects are not skipped.
- Adopt two-way CCfD settlement from commissioning, referenced to EU ETS prices rather than to an administrative trajectory, with surplus repaid to the IDB and reused in later rounds.
Build a credible pipeline and make the awards deliverable
- Concentrate funding on projects with a firm commitment to build, including anchor projects that reduce cost and risk for follow-on facilities in shared-infrastructure clusters.
- Qualify bids on project maturity and a credible pathway to long-term market viability, then rank deliverable projects on cost per tonne.
- Provide limited project development support for FEED-equivalent engineering, to widen the pool of credible bidders.
- Require bid bonds at submission and completion guarantees at FID to discipline bidding and delivery.
Coordinate infrastructure with project delivery
- Provide construction stage support for infrastructure, contingent on confirmed CCfD awards, with disbursement aligned to infrastructure delivery milestones.
- Require infrastructure projects to publish commissioning timelines, tariffs, access terms, and utilisation scenarios before the CCfD round opens, and require dependent bidders to use the same published assumptions.
- Prioritise CO₂ transport and storage networks serving multiple emitters with access to permitted permanent storage.
- Enable consortium bidding for clusters where members depend on the same shared infrastructure.
1. Introduction – Financing Europe’s industrial transition
Industrial decarbonisation is central to Europe’s climate objectives and the long-term competitiveness of its economy. Sectors including steel, cement, chemicals, and refining account for around 20%1 of CO₂ emissions and must decarbonise while continuing to operate amid high energy costs, global competition, and rising carbon prices. How this transition is managed will determine whether Europe can reduce emissions while sustaining a competitive industrial base.
The European Union (EU) and its Member States are increasing public support for industrial decarbonisation through multiple policy and regulatory mechanisms. EU-level programmes are set to allocate tens of billions of euros this decade, with the Innovation Fund alone estimated to award around €40 billion to low-carbon technologies for the period 2020–2030, depending on the European Union Emissions Trading System (EU ETS) revenues.2 Yet the scale of investment required far exceeds the funding available from existing programmes: the Draghi report estimates that decarbonising the four largest energy-intensive industries (chemicals, basic metals, non-metallic minerals, and paper) could cost approximately €500 billion over the next 15 years.3 Bridging this gap will require coordinated financing from Member States, public banks, and private capital alongside EU funding.
Despite this growing support, there is limited evidence that industrial decarbonisation is progressing at the scale and speed required. In iron and steel, cement and chemicals, the amount of greenhouse gases emitted per tonne of product remained broadly stable, suggesting that emissions reductions reflected lower production volumes rather than a transition to near-zero emission production processes.4 This raises the risk that Europe reduces emissions through declining industrial output rather than through structural transformation.
Projects are not progressing at the pace required as their underlying economics remain challenging. The cost gap between low-carbon and conventional production remains too large to close through current carbon prices and existing public financial support. At the same time, uncertainty around enabling infrastructure and misalignment between industrial and infrastructure investment continue to delay or prevent projects from reaching financial close. Without instruments that underwrite early-stage risks and coordinate infrastructure investment, private capital is unlikely to flow at the scale and speed required.5
To address these challenges, the European Commission has proposed an Industrial Decarbonisation Bank (IDB), with around €100 billion in funding to support the transition of energy-intensive industries. The IDB is expected to draw on the Innovation Fund, additional ETS revenues, and a revised InvestEU programme, and to operate within the governance of the future Competitiveness Fund.6 This represents a significant opportunity to accelerate industrial decarbonisation.
However, the success of the IDB will depend on how well it is designed. Delivering operating projects at scale requires simultaneously realising three closely interlinked enablers: timely delivery of shared infrastructure, project readiness supported by credible cost estimates, and early demand for low-carbon products.
2. Existing industrial decarbonisation financial instruments – and why deployment still lags
Public financial support for industrial decarbonisation in the EU and its Member States currently spans grants and auctions, operating support, infrastructure programmes, and public finance and risk-sharing instruments (Table 1). While these instruments cover a wide range of cost components and risks, they have not consistently led to operating projects, with a substantial share of supported projects stalling before final investment decision (FID) (Box 1).
Table 1. Overview of key EU and national industrial decarbonisation financial instruments
| Instrument | Scope and design | Cost coverage | Structural gaps7 |
|---|---|---|---|
| Innovation Fund – General Decarbonisation calls (EU) | Regular competitive calls supporting innovative net-zero and low-carbon technologies and processes, at demonstration and first commercial deployment stage. | Grant covering relevant costs – additional capex and opex less revenues over the first 10 years of operation; up to 60%. | Long-term offtake, follow-on revenue support to bridge from grant period to commercial operation, synchronised delivery of enabling infrastructure, project maturity at financial close. |
| European Hydrogen Bank (EU) | Competitive auction for renewable hydrogen (RFNBO) production, supporting early hydrogen production, price discovery, and initial scale-up. | Fixed, output-based operating premium paid on certified and verified RFNBO hydrogen production, for up to 10 years. | Long-term demand certainty, RFNBO compliance and certification, offtake and price risk, transport and storage infrastructure, revenue support beyond the contract period, post-selection attrition where projects withdraw before grant signature due to grid, power-sourcing or maturity constraints. |
| Innovation Fund Heat Auction (EU) | Competitive auction supporting electrification and renewable heat solutions for industrial process heat. | Fixed, output-based premium per unit of verified decarbonised heat production, for up to 5 years. | Grid readiness, site integration complexities, unhedged exposure to volatile spot electricity prices; lack of access to long-term corporate PPAs for lower-credit industrial counterparties below creditworthiness thresholds. |
| Connecting Europe Facility – Energy (CEF-E) (EU) | Competitive calls for cross-border energy infrastructure under TEN-E, for eligible PCIs/PMIs covering electricity, smart grids, CO₂ networks, hydrogen and electrolysers, and offshore infrastructure. | Grant covering studies and works: shared-infrastructure capex and project-development costs. | Utilisation risk, access terms and tariff design, cross-border cost-allocation and governance, alignment of infrastructure delivery with industrial project timelines, opex recovery for infrastructure operators during ramp-up phases when utilisation is low. |
| Operating aid / revenue stabilisation (national) | Member State operating support, often auction-based, including CCfD and similar revenue-stabilisation mechanisms (e.g. Germany, Netherlands, France, Denmark), improving bankability for industrial decarbonisation projects. | Operating support covering the cost gap relative to conventional production. | Shared infrastructure and permitting; demand-side buyer offtake commitments at scale; uneven Member State fiscal capacity, State aid approval timelines, and cumulation constraints. |
| Public finance and risk-sharing instruments (EU and national) | Loans, guarantees, equity, and advisory support; InvestEU is backed by an EU budget guarantee, with the EIB Group as the main implementing partner. | Financing terms / risk allocation: WACC, tenor, credit enhancement, guarantee coverage. | Structural operating cost gaps, product demand, credible underlying revenue model, project maturity, risk pricing for first-of-a-kind technology lacking actuarial track record. |
Box 1. The Innovation Fund: a large, committed pipeline, but limited deployment to date
The EU Innovation Fund is one of the world’s largest programmes for the demonstration of innovative low-carbon technologies, with an estimated €40 billion available over 2020–20308 from EU ETS revenues. Across calls from 2020 to 2024, the Innovation Fund has built a substantial project pipeline, but progress toward financial close and operation remains limited.
Figure 1. Portfolio status across all Innovation Fund calls (2020–2024)9
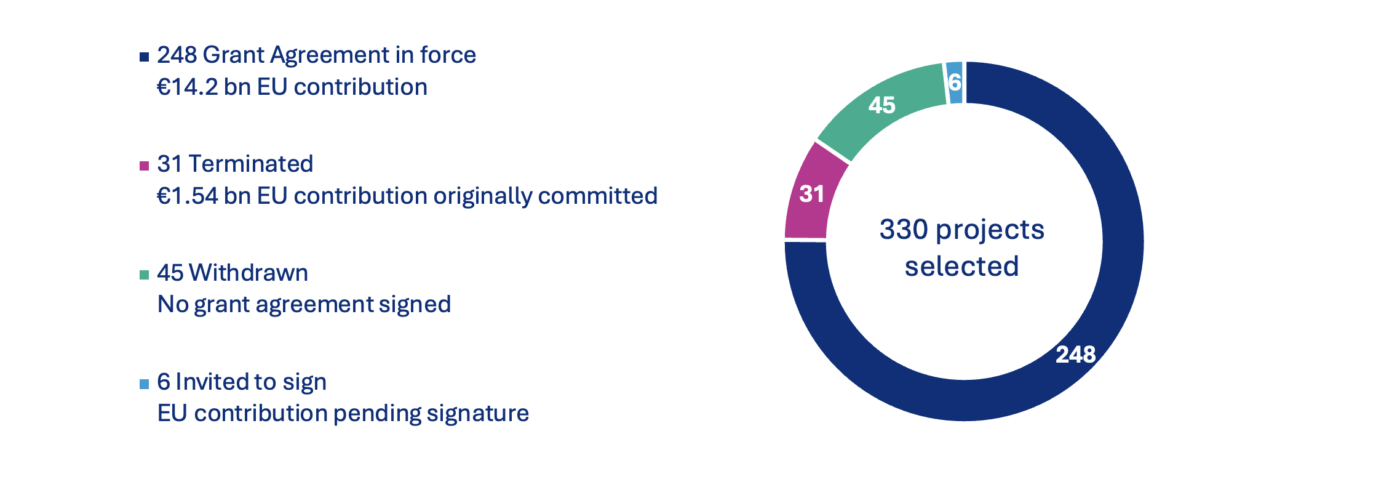
“Terminated” projects had signed grant agreements that were later cancelled. “Withdrawn” projects exited before grant agreement signature and did not receive EU funding.
Within the active portfolio, planned financial close dates provide the clearest public indication of where delivery risk is concentrated. Of the 248 active grant agreements, €8.8 billion is associated with projects scheduled to reach financial close between 2021 and 2026 (see Figure 2).8 Confirmed project-level financial close data is validated by the European Climate, Infrastructure and Environment Executive Agency (CINEA) and not publicly available. The closest public benchmark therefore comes from the Commission’s reply to the European Court of Auditors (ECA) Special Report 11/2026, which states that, across 208 signed grant agreements reviewed by June 2025, only 45 had reached financial close and 16 had entered operation.10
Figure 2. Breakdown of the 248 projects with Grant Agreement in force by planned financial close year at the time of grant agreement signature
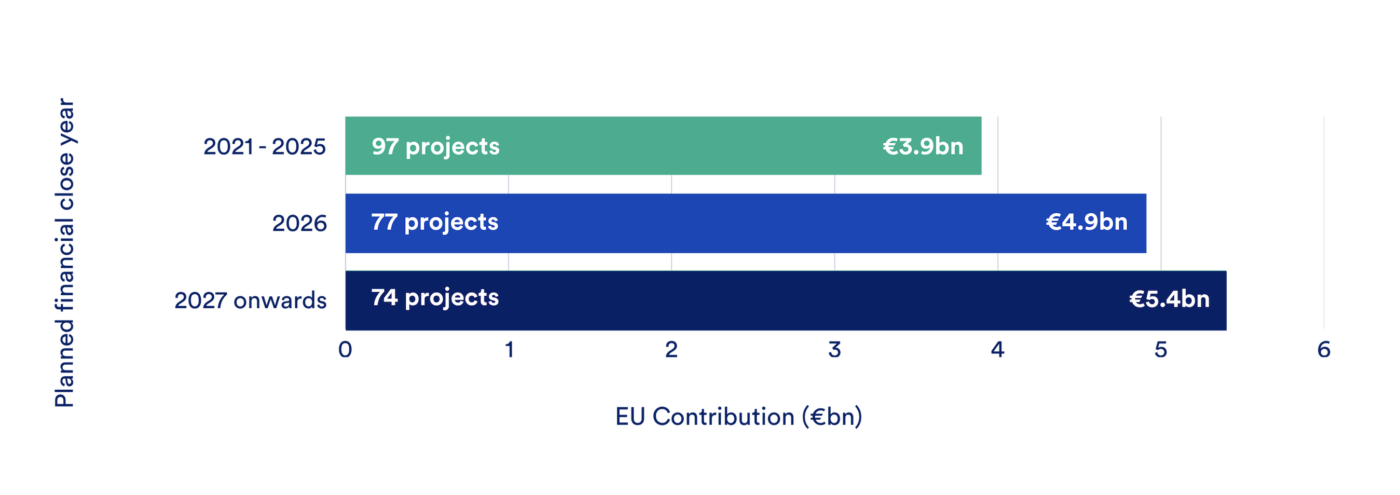
The ECA found that only €331.8 million (2.7%) had been paid to projects, compared with €2.1 billion if projects had met their original schedules. Cancellations and delays compounded the picture, with one in five originally selected projects cancelled and remaining projects averaging 14.5 months behind schedule.11
Disbursement challenges are not evenly distributed across the portfolio. Around 70% of EU funding is concentrated in sectors where projects face the greatest barriers to financial close (see Figure 3). The most persistent barriers include difficulty securing long-term offtake agreements in nascent markets, rising material and construction costs, and dependence on external infrastructure, including grid connections, CO₂ transport and storage, and hydrogen networks, which lie beyond individual projects’ control.12
Figure 3. Distribution of Innovation Fund EU contributions by sector (€bn)8
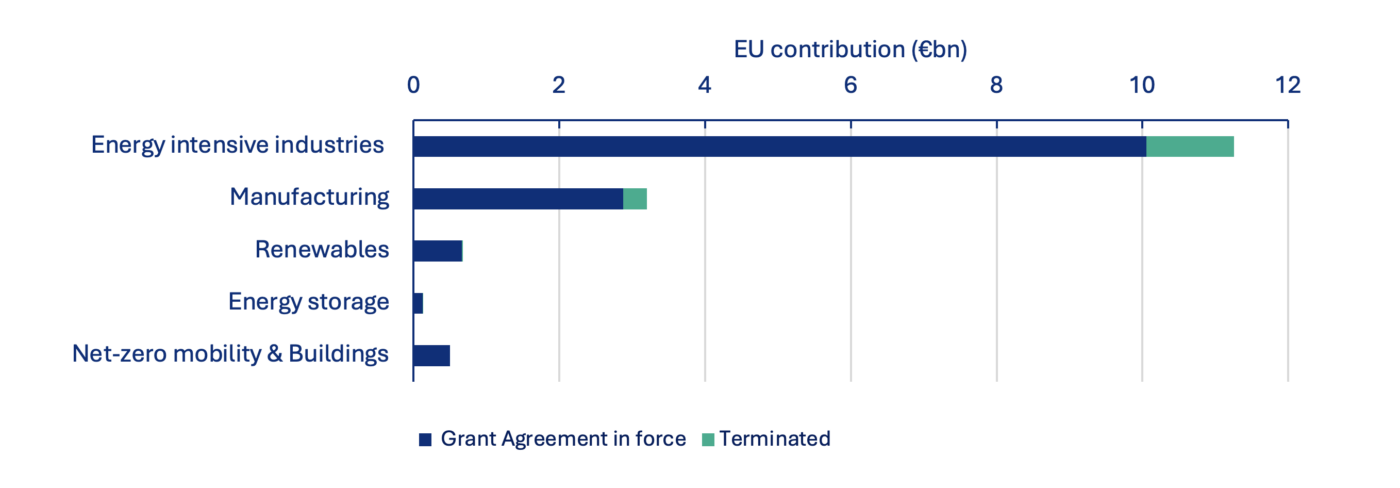
Energy-intensive industries include cement and lime, iron and steel, chemicals, refineries, glass and ceramics, pulp and paper, non-ferrous metals, and other industrial processes, including CO₂ management. Hydrogen includes both dedicated hydrogen projects and hydrogen auctions calls.
The Innovation Fund’s most concentrated funding is in sectors where post-selection delivery faces the greatest barriers, and its mandate focuses on demonstration and first commercial deployment rather than on scaling proven technologies.
The gap between funding and delivery reflects a deeper structural challenge. Support remains fragmented across instruments, preventing projects from moving smoothly from funding to delivery and leading to differing assessment processes, eligibility criteria, and delivery timelines. Investments, operating aid, permitting, grid connections, and cross-border infrastructure development are carried out through separate processes that do not always align at the EU and Member State levels. The accumulation of EU and national support, while often encouraged, is governed by State aid rules that prevent overcompensation and vary by route.
This fragmentation raises transaction costs and weakens project readiness. Cost estimates and delivery assumptions developed at different stages of project development for separate instruments leave developers carrying assumptions that may no longer hold by the time funding decisions are made.
The Commission’s Grants- and Auctions-as-a-Service options under the Innovation Fund are recent steps to strengthen EU–Member State complementarity by allowing Member States to allocate additional national budgets through a common EU framework in a State aid-aligned manner. While these approaches can improve funding alignment, they do not by themselves address the full delivery chain on which projects depend, including long-duration revenue support, infrastructure access terms and tariffs, and coordinated commissioning. Differences in Member State fiscal capacity further exacerbate uneven delivery conditions across the EU.
The cost gap between low-carbon and conventional production persists throughout the operating life of industrial assets and remains only partially addressed by current support. Capital grants and time-limited operating support reduce upfront costs and stabilise revenues during the contract period, but projects can remain commercially challenging where buyers are unwilling to pay a premium for low-carbon products or when energy and carbon price volatility extends well beyond the support window. Without guaranteed demand and long-duration revenue support, developers struggle to develop a bankable business case. Carbon contracts for difference (CCfD) and similar revenue support instruments stabilise revenues against incumbent production routes and can establish a viable business model, but they often need to be complemented by capital grants, concessional loans, and risk guarantees13 to address the capital, infrastructure, and regulatory risks that may not be covered by revenue stabilisation alone (Table 1).
Industrial decarbonisation also depends on shared infrastructure beyond the facility boundary across CO₂ transport and storage, hydrogen networks, and electricity grids, yet support for this infrastructure does not automatically translate into bankable access conditions for industrial users. The misalignment is most visible under the Trans-European Networks for Energy (TEN-E) Regulation and the Connecting Europe Facility (CEF)14, where Projects of Common and Mutual Interest (PCI/PMI) are eligible for CEF Energy support, which operates on a separate eligibility and sequencing track from industrial projects that depend on that infrastructure. Commissioning timelines under TEN-E/CEF are not required to align with industrial FID schedules, increasing commissioning and cross-chain risk for first movers. Permitting and administrative capacity compound these timeline risks, particularly for grids and CO₂ storage. Where infrastructure depends on early utilisation to recover costs, underutilisation at commissioning can raise user tariffs and weaken project economics.15 As a result, industrial projects cannot rely on firm commissioning timelines, access terms, or predictable tariff assumptions to underpin FID. Even where sufficient clean power exists at the system level, electricity availability and grid access at the location, scale, and timing required for industrial operation are increasingly lacking.
3. Sectoral and technological challenges
There is no single technological pathway for industrial decarbonisation, and net-zero-compatible projects cannot be delivered by targeting only the lowest cost abatement options. Technology pathways, cost structures, commercial maturity, and reliance on enabling infrastructure vary significantly across sectors, with direct implications for how public support and risk-sharing need to be designed. Across steel, cement, refining, chemicals, and pulp and paper, decarbonisation hinges on capital-intensive and infrastructure-dependent pathways, including carbon capture and storage (CCS), clean hydrogen, and electrification of industrial heat (Table 2).
For example, the EU cement sector emits around 120 Mtpa of CO2 across 200 emissions-intensive clinker-producing facilities. While demand for clinker can be reduced significantly through material efficiency and clinker substitutes, sectoral roadmaps indicate around half the current emissions could need addressing through CCS16 – implying a need for at least €20bn in capital investment at current cost estimates. The EU petrochemicals industry is built around 34 steam crackers, producing roughly 19 Mt of ethylene annually and over 30 Mtpa of CO₂.
Indicative estimates suggest that decarbonising these crackers through electrification or blue hydrogen retrofit would imply roughly €50bn in capital expenditures at around €1.1bn per cracker17; post-combustion capture across the same crackers would imply around €18bn at approximately €0.5bn per cracker.18 These cost estimates cover installations at the facilities and exclude supporting infrastructure such as transmission, CO₂ pipelines, and clean power generation. Estimates for CO₂ transport infrastructure investment needs range from €9 to €23bn19, while the European Hydrogen Backbone is projected to cost €80-143bn.20 These figures illustrate the scale of investment required within a single industrial sector.
Many decarbonisation projects will span multiple sectors within a region or cluster and must be planned and optimised as an integrated system. Individual industrial sites will need to share infrastructure, clean heat and power, benefit from economies of scale, and operational synergies such as waste heat availability. This type of system-level coordination can improve project economics, enabling the clusters to operate more efficiently at scale.
Table 2. Emissions, pathways, and indicative costs across the five energy-intensive industries
| Sector | Direct emissions (Mtpa)21 | Number of facilities21 | Key pathways | Abatement cost (€/tCO₂) | Indicative capex per project (€bn) |
|---|---|---|---|---|---|
| Steel | 93 | 23 (blast furnace sites) ~100 large EAF sites | BF-BOF CCS retrofit; DRI-EAF + CCS; Blue H₂ DRI + EAF; Green H₂ DRI + EAF | 140–30022 | 1-1.623 |
| Cement | 95 | 200 (clinker production) | Post-combustion capture, oxyfuel, PSA capture; clinker substitution; alternative fuels | 110–22024 | ~0.35-0.725 |
| Chemicals | 78 16 (ethylene oxide and plastic) | 30 (steam cracker sites) | Electrification; blue hydrogen retrofit; post-combustion capture | 145-22026 | 0.35-1.5 (steam crackers)27 |
| Refining | 116 | 65 | Process heat electrification; clean hydrogen; CCS | 250-32028 | 0.7-0.928 |
| Pulp and paper | 84 (~80% biogenic) | ~215 large sites | Energy efficiency; demand-side flex; fuel-switching; electrification; CCS / bio-CCS | 60–17029 | 0.25-0.724,29 |
3.1. Delivering carbon capture and storage at scale
Carbon capture and storage (CCS) is an essential decarbonisation pathway for industrial sectors with process emissions and hard-to-abate heat. It relies on the development of new value chains – connecting CO₂ capture at industrial sites to large-scale infrastructure for the transport and storage of CO₂, which must be permitted, financed, and delivered on aligned timelines. This creates delivery challenges that extend beyond individual projects, as capture, transport, and storage must be developed and financed as a coordinated system with aligned timelines and incentives.
Across Europe, more than 100 CCS projects have been announced, yet only 11 have reached a FID.30 The Porthos project in Rotterdam is notable as the only CCS project progressing in energy-intensive industries, with the aim of transporting and storing CO₂ from hydrogen production for refineries. The gap between announcements and FID highlights the challenge of converting project ambition into full-chain delivery. Key barriers include full-chain delivery and cross-chain risk allocation, revenue exposure, uncertain terms of access to transport and storage, commissioning delays, outage risks, and uncertainty over early utilisation.
Notably, CCS projects have reached FID when public funding and state coordination have reduced upfront costs, aligned infrastructure and capture project delivery, and provided operating support paid against verified tonnes stored. Porthos combined EU infrastructure support through CEF grants, long-duration operating support reserved for initial customers through SDE++ (up to €2.1bn), and additional national risk-sharing measures in the pre-investment phase, including a government guarantee, alongside state-linked finance.31 Carbon dioxide removal (CDR) offtake agreements can provide an important revenue stream, but in practice, they have tended to complement rather than substitute investable transport and storage infrastructure or long-duration support tied to verified storage. Stockholm Exergi BECCS project has also made use of blended financing, combining national operating support (~€1.7 bn)32, EU Innovation Fund support (€180m)33, European Investment Bank (EIB) loan (€260m)34, and a long-term corporate removals offtake with Microsoft (5.08 Mt over 10 years).35 These examples highlight that CCS projects progress where blended financing addresses multiple risks across the full value chain, rather than relying on a single revenue stream.
Denmark’s CCS Fund illustrates how tender design can shape participation. It procures full-chain delivery through consortia and links support to strict milestones. While 16 projects applied and 10 prequalified, only two final bids were submitted, indicating that concentrating interface and availability risk within consortia can deter participation even where the funding envelope is large.36
Scaling CCS depends on making shared transport and storage (T&S) investable ahead of fully committed volumes, capture projects receiving long-duration operating support linked to verified stored CO₂ tonnes, and predictable rules applying across capture, transport, and storage for commissioning delays and outages. A delivery-focused approach, therefore, needs to align risk allocation and incentives across the full chain so that projects can reach FID and operate through early ramp-up conditions.
3.2. Delivering industrial electrification
Industrial electrification depends on coordinated action across technology providers, industrial sites, grid operators and utilities, alongside competitive and predictable electricity prices. Meeting industrial electrification demand requires major grid investment, both to connect new clean generation and to upgrade existing industrial connections, which are often insufficient to accommodate additional process loads. Beyond grid infrastructure financing37, industries may require both capital expenditure (capex) support for electrification technologies and operational expenditure (opex) certainty to make the transition economically viable.
For sectors like food and beverage – where most of the energy use is in low temperature heat <150°C – there are commercially mature technologies such as heat pumps and electric boilers which could be deployed. The challenge is not technical feasibility but economic viability amid high and volatile EU electricity prices, as well as the practical realities of site integration and process redesign. The IDB should focus its resources on mature pathways. For many industrial applications requiring medium-to-high temperature heat, further R&D is needed to mature leading technologies currently at the prototype or pre-commercial stage. These more novel technologies should be targeted and funded through the Innovation Fund and the €600 million Horizon Europe flagship call under the Clean Energy Investment Strategy (CEIS).
CEIS inter alia aims to support grid connectivity by strengthening grid operator balance sheet through the strategic infrastructure investment (SII) fund (equity co-investment), Operator Securitisation Facility (converting regulated revenues into securities), and hybrid bonds. As such, it supports grid investment at the supply side (operator financing) rather than taking the perspective of industrial demand requiring grid access. There is no mechanism that finances the industrial customer’s capex bundle (equipment + connection + reinforcement) as an integrated instrument. The strategy also does not address demand-side Power Purchase Agreement (PPA) support. The recurring pattern of gas-driven electricity price shocks makes a compelling case that EU industry cannot rely on spot markets alone for energy procurement and that public finance should not be the default backstop every time prices spike. Long-term contracts stabilise revenues for producers, making investment projects bankable, while providing consumers with more predictable electricity prices and lowering the financing costs. However, PPAs also face significant barriers: they require creditworthiness guarantees for long-term commitments, are resource-intensive to negotiate, and remain largely inaccessible to smaller and medium-sized industrial operators who cannot offer the credit security that generators require.
3.3. Delivering clean hydrogen
Clean hydrogen is a critical tool for decarbonising refining and fertiliser production, where it is required as a feedstock, and is the most viable option for decarbonising primary steel production. Clean hydrogen can be produced via a range of pathways, including electrolysis and natural gas reforming with CCS. The EU currently consumes an estimated 7.3 Mtpa of hydrogen, with refining and ammonia production accounting for 84% of use. This existing production is associated with roughly 50 Mtpa of CO₂ emissions, meaning limited early clean hydrogen volumes can maximise near-term climate value by displacing incumbent unabated supply in those sectors.38
EU policy targets 10 Mt of domestic renewable hydrogen production by 2030, with an additional 10 Mt of imports.38 Under the Renewable Energy Directive (RED), 42%39 of hydrogen used in industry should be renewable by 2030, equivalent to 1.3 Mtpa.40 In 2024, only 60 kt of renewable hydrogen was produced in the EU, well short of the RED mandate.41
This gap between targets and delivery is also visible in project-level support. Hydrogen Bank auctions are designed to accelerate early renewable hydrogen supply through competitive, time-limited operational support. Early rounds showed significant market interest, but awarded projects fell short on delivery; in the second auction round, seven selected projects did not proceed to the preparation of grant agreements.42 Binding constraints often sit after selection, when projects must continue to develop capital cost estimates, secure firm grid connection, credible power sourcing, and bankable long-term offtake before they can reach FID and commissioning.
These delivery constraints are reinforced by the economics of clean hydrogen. Electrolytic hydrogen remains electricity-intensive and highly sensitive to electricity prices and grid access; many industrial users require a stable hydrogen supply; and policy rules intended to ensure renewable integrity (additionality and temporal/geographic correlation) constrain operating profiles and raise delivered costs. Recent project experience also reflects a persistent cost gap, with cited average clean hydrogen costs of around €7/kg, compared with about €3.5/kg for conventional unabated hydrogen.33
Transportation of hydrogen over long distances add significant costs and infrastructure complexities, and production should initially be targeted in proximity to demand.43 Producing clean hydrogen within or close to major industrial demand clusters reduces reliance on long-distance transport, new cross-border networks, and uncertain “last-mile” build-out under tight timelines. When low-carbon hydrogen relies on the reformation of natural gas with carbon capture, delivery timelines also become coupled to the availability of CO₂ transport and storage.
Scaling hydrogen, therefore, depends on anchoring early supply in existing industrial demand, reducing post-selection attrition by improving power, grid, and offtake readiness at the time of subsidy award, and aligning production support with the infrastructure needed to unlock project delivery.
4. Designing an Industrial Decarbonisation Bank
Industrial decarbonisation will only be delivered at scale if three conditions are met simultaneously: projects have investable economics, enabling infrastructure is available on time, and early demand for low-carbon products begins to emerge.
IDB should allocate project-level support primarily through competitive Carbon Contracts for Difference (CCfD), complemented by project development support to improve bid readiness and targeted support for shared enabling infrastructure where common assets are necessary for projects to compete credibly. Funding should be concentrated on deliverable projects able to reach financial close within a defined timeframe, with anchor projects in industrial clusters underpinning the shared infrastructure that subsequent facilities depend on.
To be effective, the three instruments should operate as a single system rather than as standalone interventions. Development support and infrastructure selection should precede or overlap with the CCfD round so that bidders enter the competition with sufficient cost certainty and credible assumptions about infrastructure access.
Figure 4. IDB as a coordinated source of funding.
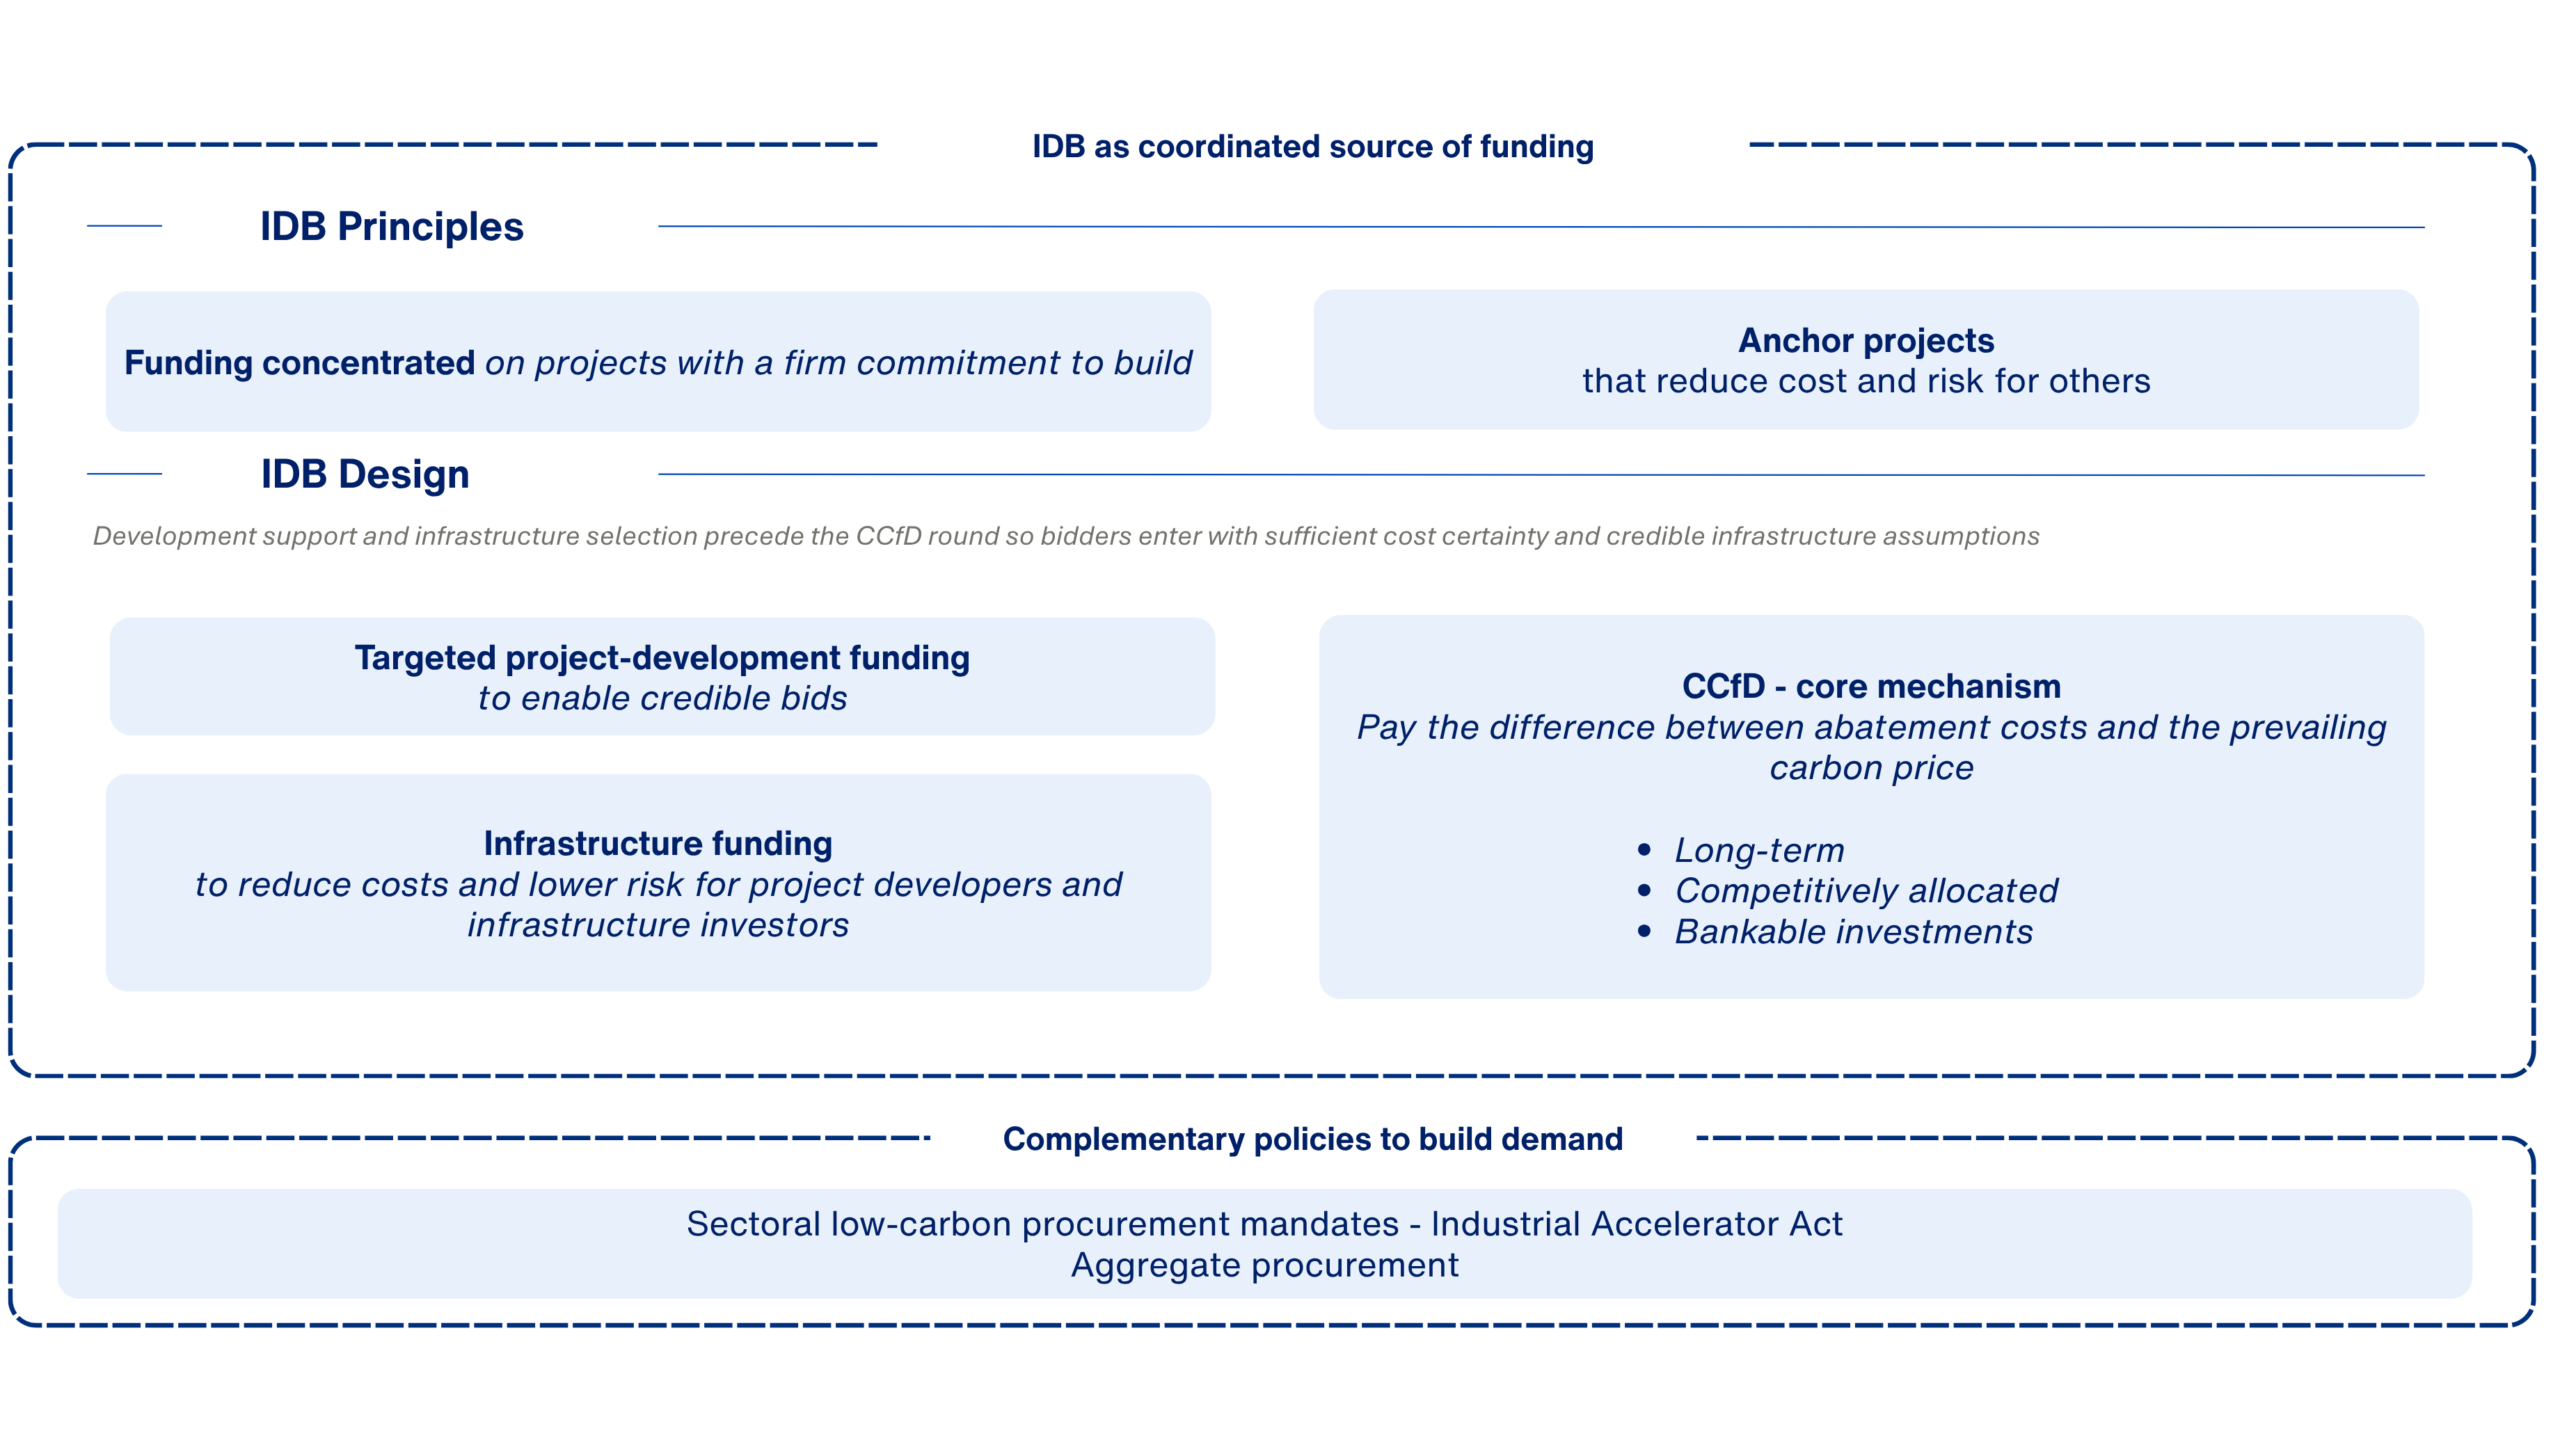
Projects dependent on shared CO₂ networks, hydrogen pipelines, or grid reinforcement cannot submit a credible bid until reference assumptions on tariffs, access terms, and commissioning timelines have been published. The infrastructure and CCfD instruments should advance in parallel, with infrastructure support conditional on sufficient CCfD awards confirming a viable user base. Because development support brings projects to bid-readiness over time, the IDB would run repeated CCfD rounds: early rounds drawing on projects already mature, later rounds open to projects that development support, or time, has since brought to readiness.
Moreover, supply-side support will need to be complemented by growth in demand for low-carbon products – both in market volume and in willingness to pay a green premium. Mandates for public procurement of low-carbon products, such as those proposed under the Industrial Accelerator Act (IAA)44, can help build this demand; however, as currently proposed, they represent a small fraction of the EU’s industrial output. As a result, the IDB will need to bridge the transitional period in which projects rely on public support before market demand fully develops.
4.1. Coordinating infrastructure and process decarbonisation
Some decarbonisation pathways depend on shared assets that no single industrial facility can finance, permit, or coordinate alone, including CO₂ transport and storage networks serving multiple emitters, hydrogen pipelines and storage in industrial demand clusters, and electricity grid reinforcements removing capacity constraints across multiple users.
These assets face a fundamental coordination challenge: shared infrastructure cannot reach FID without a credible user base, while industrial decarbonisation projects require reliable access to infrastructure before committing to investment.
Under the IDB, the CCfD round could confirm this demand: where enough projects in a cluster receive CCfDs, the resulting user base would allow the infrastructure to reach FID. IDB can then release reserved infrastructure capital in response to this demand on a coordinated schedule. Projects proceeding on their own investment decisions would count towards the user base, but the IDB should make its infrastructure funding conditional on confirmed CCfD awards.
4.1.1. Coordinating CCfD bids with shared infrastructure
CCfD bidders dependent on shared infrastructure cannot submit credible bids without published reference assumptions on commissioning timing, access terms, tariff methodology, indicative tariff levels, and available capacity. Where infrastructure economics are sensitive to utilisation rates, the published range covers low, central, and high throughput scenarios based on the user base confirmed at the time of publication.
France’s CCfD45 consortium provision allows multiple sites, depending on shared infrastructure, to bundle their bids: each site submits its own offer with its own price, emissions reduction, and production volume. Offers are scored individually, then combined into a consortium rating. Selection is all-or-nothing across consortium members, reflecting the commercial reality that shared infrastructure economics collapse if anchor emitters drop out.46 Once selected, each project is paid individually on its own bid.
Germany’s CCfD47 takes a narrower approach: the default unit of bidding is a single facility, with joint applications permitted only where facilities share a formal technological link, defined as actual transfer of intermediate products between production processes. This definition excludes shared-infrastructure clusters in which multiple emitters use the same CO₂ pipeline or storage hub but do not have intermediate-product flows between them, thereby limiting the ability of cluster-based projects to coordinate risk within the auction and increasing exposure to individual project failure.
Published reference assumptions handle coordination on tariffs and access terms across cluster members, allowing individual bids to enter the auction on a common cost basis. However, this alone does not address the interdependence between projects within a cluster. Consortium bidding tackles a different coordination problem: the commercial exposure between cluster members where one site’s CCfD award failing on price would leave remaining members with infrastructure economics that no longer support their own bids. The two mechanisms address different parts of the cluster coordination challenge. While published reference assumptions standardise input costs across a cluster, consortium bidding directly mitigates the commercial exposure members face if an interdependent anchor project fails to secure an award.
To allow shared infrastructure clusters to bid coherently, the IDB’s CCfD framework should:
- Enable consortium joint bidding by cluster members dependent on the same shared infrastructure
- Require infrastructure projects to publish reference assumptions on commissioning timing, access terms, tariff methodology, and utilisation scenarios before the CCfD round opens.
- Require all cluster members that depend on the same infrastructure to use identical published assumptions in their cost build-up.
4.1.2. Staged support for infrastructure projects
Infrastructure support could follow project maturity, with IDB’s commitment increasing as user-base evidence and delivery readiness strengthen across three stages (Table 3). Where CCfD bids depend materially on shared infrastructure, infrastructure selection would precede the CCfD round, allowing bidders to rely on published reference assumptions at the bidding stage, with assumptions updated at each milestone and revalidated before dependent CCfD awards are activated.
Table 3. Indicative support pathways for shared enabling infrastructure
| Infrastructure maturity | What the project must show | Potential IDB support | Eligible for use in CCfD bids | Progression condition |
|---|---|---|---|---|
| Early-stage infrastructure | Pre-FEED or early planning; potential to serve multiple users; early user interest and an indicative user base | DevEx support for FEED, technical studies, permitting studies, stakeholder engagement, and open-access design work | No | FEED completed; permitting pathway clarified; stronger evidence on access terms, costs, and demand |
| Advanced infrastructure | FEED completed; permitting submitted or initiated; access conditions and tariff approach published; commissioning pathway defined; published range of tariff and cost assumptions under low, central, and high utilisation scenarios, based on the confirmed indicative user base | Provisional, milestone-based reservation of potential future capital support; no construction disbursement until minimum user thresholds and delivery conditions are met | Yes, provisionally, on published assumptions and subject to revalidation | Delivery milestones met; updated cost estimate provided; stronger user commitment evidence secured |
| Delivery-ready infrastructure | Updated cost estimate; milestones maintained; sufficient reserved or binding user commitments; access arrangements in place; downstream CCfD awards confirmed | Full milestone-based capital support, binding subject to CCfD award confirmation and milestone delivery | Yes, on approved assumptions | — |
To stage infrastructure support against project maturity and downstream user-base evidence, the IDB’s infrastructure support framework should:
- Make construction stage infrastructure support contingent on confirmed CCfD awards, with disbursements aligned with infrastructure delivery milestones.
4.1.3. Assessment criteria for infrastructure support
The IDB should assess infrastructure proposals on system value and on deliverability, rather than on the standalone financial return of any single downstream project. System value reflects the extent to which an asset enables multiple users and reduces the total decarbonisation cost across them. Deliverability reflects the project’s path to commissioning and the credibility of cost and timeline assumptions.
Table 4. Assessment criteria for shared infrastructure support under the IDB
| Criterion | Description |
|---|---|
| Emission reduction potential | Expected emissions reductions enabled across committed and potential downstream users within a defined industrial cluster, corridor, or network area |
| System cost effectiveness | Extent to which the infrastructure lowers total decarbonisation cost across multiple users, rather than only for a single project |
| Cluster coverage | Number and diversity of industrial facilities the asset can serve at commissioning and over time |
| Deliverability | Project readiness, including engineering maturity, permitting status, financing pathway, procurement readiness, and construction feasibility |
| Scalability | Ability to expand capacity, connect additional users, or integrate with wider network development |
| Cross-border and interoperability | Compatibility with wider regional or EU-level infrastructure systems, including technical interoperability and open-access design |
| Private co-financing | Level of private/commercial capital relative to requested public support |
| Utilisation risk | Whether likely users will materialise on time and whether the infrastructure remains viable and affordable if early utilisation is lower than expected. In addition, the long-term site durability and economic viability of anchor facilities should be assessed to ensure they are resilient to premature closure. |
4.1.4. Infrastructure considerations
CO₂ transport and storage is the primary case for IDB support, as the absence of permitted shared infrastructure leaves emitters with capture-ready facilities without access to storage. The IDB should prioritise CO₂ networks that serve multiple emitters on open and non-discriminatory terms, secure access to permitted permanent storage, provide a scalable backbone, and publish the access and tariff assumptions that downstream bidders need. Those tariffs depend on utilisation: the fewer users connected at commissioning, the higher the tariff each project pays to cover the infrastructure’s costs. The IDB may provide strictly capped, time-limited utilisation support, subject to reconciliation, clawback, and periodic revalidation. This approach can stabilise early project economics while the user base develops, without creating long-term dependence on public support.
CCS-dependent CCfDs carry cross-chain risk between the capture project and shared CO₂ transport and storage. Shared infrastructure may be commissioned late, experience outages, or operate at lower utilisation than assumed at the bid stage, with projects that have captured CO₂ but cannot store it facing both lost CCfD revenue on those volumes and continued ETS exposure. The UK Industrial Carbon Capture Contract48 handles the CCfD-side risk directly in the contract: when transport and storage are unavailable through no fault of the capture project, capital payments continue, operational payments continue at a reduced level, and irrecoverable losses during commissioning delays are compensated where the project has met its own performance criteria. Building this into the IDB CCfD would protect contracted projects from financial consequences of infrastructure delay outside their control. Managing risk within the contract gives projects certainty in advance and removes the risk premium they would otherwise factor into their bids. Any such provision needs to be bounded in duration and scope to limit the IDB’s overall exposure. Applied this way, the provision reaches only projects holding an IDB CCfD contract. CCS projects that secured their funding through other routes would need a separate mechanism to address this risk, potentially funded from the IDB budget. This could take the form of a ring-fenced, time-limited guarantee mechanism within the IDB, covering a defined share of residual ETS exposure for captured volumes that could not be stored during verified network outages. The mechanism would phase out as value-chain operators build their own allowance buffers and shared infrastructure matures.49 Addressing these risks is critical to ensuring that projects remain financially viable during early operation.
For industrial electrification, the binding constraint is grid capacity and the timing of connection works. IDB support should target substations, connection infrastructure, and local distribution reinforcements linking industrial sites and clusters to the grid, on timelines aligned with industrial commissioning and consistent with national network plans and acceleration areas. Where transmission-level upgrades are necessary to serve industrial clusters but exceed normal transmission system operator investment cycles, the IDB could co-finance with the EIB and national grid programmes. The EIB’s PPA counterparty pilot50 could be scaled and extended to industrial clusters through guarantees backed by the IDB’s InvestEU component, providing credit enhancement and tenor extension for smaller off-takers signing 10–15-year contracts. Where Member States deploy tripartite agreements51, IDB instruments should reinforce rather than duplicate this architecture. Taken together, these measures would ensure that grid access and electricity price risk do not prevent otherwise viable electrification projects from proceeding.
Hydrogen pipeline, compression, and storage assets in existing industrial demand clusters cannot be financed against speculative future demand. IDB support should be limited to shared assets serving credible supply pathways, committed conversion timelines, and published access and tariff conditions, and should not extend to demand beyond the CCfD delivery horizon. Coordination with the Hydrogen Bank52 would allow the two instruments to address complementary segments of the value chain. This would help anchor early hydrogen deployment in locations where both supply and demand can develop in tandem.
4.2. Design of Carbon Contracts for Difference
CCfDs pay projects the difference between a competitively bid strike price and a defined carbon-price reference, multiplied by verified eligible tonnes of CO₂ avoided. CCfD-style schemes are now operating in Germany (Klimaschutzverträge (2024); CO₂-Differenzverträge (2026)), France (Grands projets industriels de décarbonation), the Netherlands (Stimulering Duurzame Energieproductie en Klimaattransitie (SDE++)), Denmark (CCUS and CCS Funds), and the UK (Industrial Carbon Capture Contracts (UK ICC Contracts)). While these schemes demonstrate the potential of revenue stabilisation, they have addressed major design parameters differently, with implications for which projects reach financial close, sector coverage, and cost effectiveness.53
4.2.1. A common bid metric across decarbonisation pathways
Decarbonisation pathways differ significantly in their abatement costs (Table 2), and CCfDs therefore need a single competitive metric by which different bids can be ranked. Without such a basis, auctions risk favouring narrower sets of projects rather than supporting the system-wide solutions required.
Germany’s CCfD ranks bids on euros per tonne of CO₂ reduction relative to a reference plant defined using EU ETS product benchmarks (with fallback benchmarks for heat or fuel where product benchmarks are not defined).54 This aligns with existing EU ETS accounting and is familiar to heavy industry but requires a benchmark to be defined for every eligible sector before the auction opens, with the maintenance burden growing as the programme expands. EU ETS benchmarks are revised periodically; Germany addresses this by fixing the benchmark at the funding-call level for all contracts awarded in that round, with substitution rules applying as EU benchmarks are updated over the contract life. France’s CCfD ranks bids on euros per tonne avoided across electrification, hydrogen, CCS, efficiency, and fuel switching within a single auction, using a project-specific historical baseline rather than a sectoral benchmark.55 This common metric simplifies comparison and reduces administrative complexity at the bidding stage but reduces the ability to account for technologies with structurally different cost profiles, which can leave higher-cost pathways uncompetitive across successive rounds, particularly where sectoral caps are not in place. The Netherlands CCfD runs a single competitive ranking signal in euros per tonne with technology-specific base rates and separate emission factors for each category.56 This combines the ranking simplicity of a common metric with the flexibility to handle technology-specific cost structures, though it requires determining appropriate parameters for each eligible technology before each round.
To establish a common basis for comparing bids across pathways, the IDB’s CCfD framework should:
- Apply a common ranking metric of euros per tonne of CO₂ avoided across electrification, fuel switching, efficiency, hydrogen, and CCS.
- Apply a single baseline methodology across all eligible pathways, using EU ETS product benchmarks with heat or fuel fallbacks where no product benchmark is defined.57
4.2.2. Sector safeguards within technology-neutral auctions
A CCfD can rank all eligible projects together in a single auction or run separate auctions by sector or technology.58 A single auction can increase competition, while separate auctions are easier to implement.59 Running a separate auction for each sector or technology fixes each category’s budget share before bidding, committing budget to sectors whose demand is not yet known. In a single CCfD auction, where bids are ranked by cost per tonne across all eligible pathways, sectors with higher-cost decarbonisation pathways are disadvantaged, as the ranking favours the lowest-cost bids. This often affects sectors where decarbonisation requires fundamental changes to industrial processes rather than incremental improvements (Table 2).
A single auction can address this through a safeguard on how the budget is distributed. Safeguards can cap how much of the budget any single sector draws, or ring-fence the budget for particular technologies or sectors. A cap leaves every bid in the same competitive ranking, so capped sectors meet the same readiness, MRV (monitoring, reporting, and verification), and compliance requirements as all other bids.
The Netherlands SDE++ ranks all categories into a single competitive pool on subsidy intensity per tonne of CO₂ avoided, with no per-sector allocation, reserving budget instead for certain technology domains that revert to open competition if unused.60 Because those ring-fences are defined by technology domains rather than by sector, the design steers support toward particular technology routes but applies no constraint on how awards are distributed across industrial sectors.
France’s GPID had a per-sector cap in its 2024 round, with no single sector able to draw more than one-third of the envelope, applied across five administratively defined sectors. The first round selected seven projects from nineteen applications, three of them in cement.61 The 2026 round removed the sector cap, relying instead on a per-project ceiling of €450 million on provisional aid, with no limit on cumulative concentration in any single sector, so the design has moved from constraining sectoral concentration directly to leaving it to project-level controls alone.
Germany’s first round, run as a single €4 billion pool, drew 17 bids for 15 awards and excluded carbon capture due to a lack of a regulatory framework. Competition in that round was low, with one project accounting for more than half of each awarded sector’s budget.62 For the second call, Germany took a different approach: a two-pool budget. A €3 billion base pool is open to bids from all eligible sectors, with a cap of €1 billion per sector, and a per-project cap of €700 million. In parallel, a separate €2 billion additional pool has no sector restriction, allowing high-cost projects to secure further funding beyond the base pool, up to a total of €2.5 billion per project across both pools. A uniform bid ceiling of €550/tCO₂e applies across all sectors regardless of the underlying cost structure. The cap limits cumulative draws rather than reserving budget in advance, so a sector that bids below its cap leaves the unused budget available to others.
Figure 5. The IDB auction mechanism
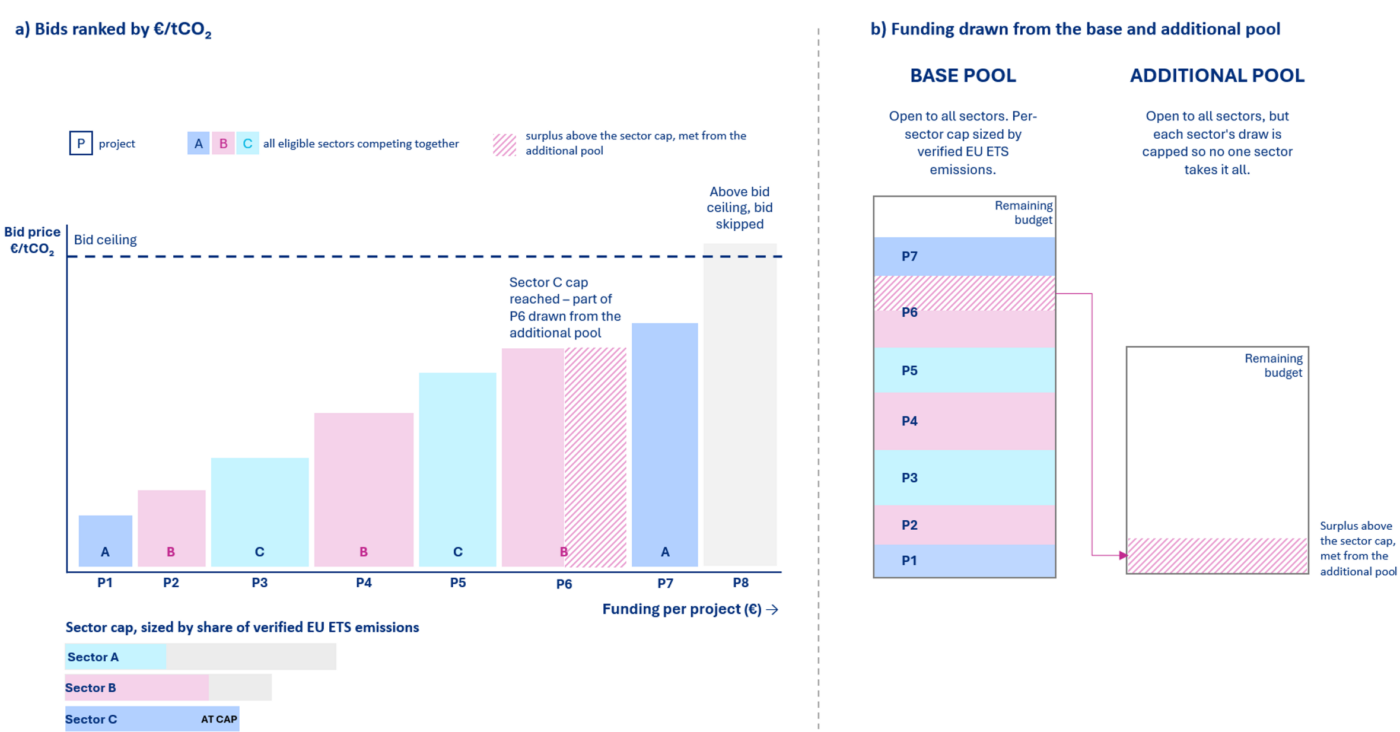
Under a uniform sector cap approach, a lower-cost project is skipped once its sector reaches the cap, while a higher-cost project in a different sector with still available budget is funded.
The IDB can avoid this by pairing the sector cap with a shared pool that capped sectors draw on (Figure 5). Each sector draws from a base pool, capped at its share of verified EU ETS emissions, so larger sectors are allowed a larger share. Once a sector reaches its cap, its subsequent projects are not skipped; they draw from an additional pool open to every sector. This keeps a lower-cost project in contention whilst ensuring funding is spread across multiple sectors. Access to the additional pool is limited per sector, so no one sector exhausts it. A bid ceiling caps the price per tonne, set higher for pathways with structurally higher costs. A single ceiling on total support per project, applied across both pools, prevents any one project from taking a disproportionate share.
The same additional pool also helps consortium bids. Where members bid across sectors, a member whose sector is full can draw from the additional pool rather than bringing down the whole bid, provided the sector’s additional-pool limit has not also been reached.
To limit sector concentration without skipping lower-cost projects, the IDB’s CCfD framework should run a single competitive auction structured around two pools:
- Set each sector’s base-pool cap in proportion to its share of verified EU ETS emissions.
- Open an additional pool, available to all sectors, that projects draw on once their sector’s base-pool cap is reached. Limit each sector’s share of the additional pool.
- Set a ceiling on total support per project, applied across both pools.
- Set a bid ceiling per tonne, higher for pathways whose costs are structurally higher.
4.2.3. How CCfD payments respond to market conditions
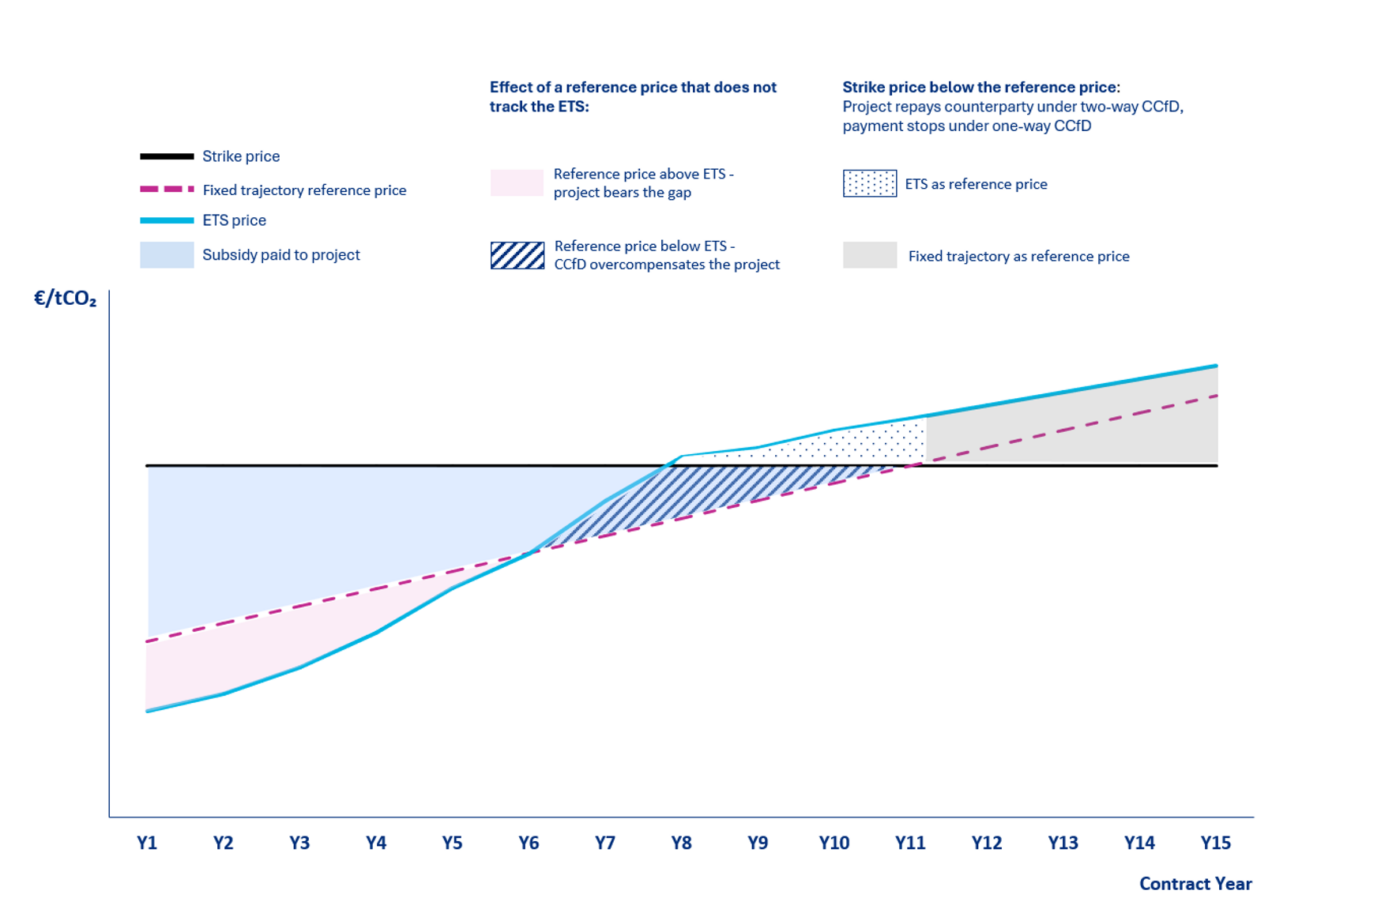
Where the CCfD pays only when the carbon price falls below the strike price, the public authority cannot recover value when the price later rises above it, and over a 15-year contract life that exposure accumulates. The Netherlands CCfD runs one-way, paying when the carbon price falls below the strike price, but stopping when it rises above, leaving the public authority with no mechanism to recover payments made when market conditions no longer justify them.63 Germany’s CCfD runs two-way from commissioning, with the project repaying the surplus when the ETS price exceeds the strike price, capping the public authority’s exposure over the contract life.64 The one-way approach gives developers a stronger incentive, but leaves the public bearing the contract’s long-term risk with no claim on the project’s returns once the carbon price rises above the strike price.65
Settlement direction depends on the reference price tracking the carbon market projects face and the size of each payment on the gap between that reference and the strike price. France’s GPID settles against a fixed administrative trajectory used as the reference price set by the national Agency for Ecological Transition (ADEME), rising from €130 per tonne in 2030 to €300 by 2050.66 The actual ETS price could diverge from the fixed trajectory in either direction over the contract life. When ETS prices rise above the administrative trajectory, the CCfD compensates against a reference below the actual ETS, overcompensating the project. When ETS prices fall below the administrative trajectory, the CCfD compensates against a reference above the actual ETS, leaving the project to bear the gap (Figure 6). By contrast, Germany’s CCfD uses an average of recent EU ETS prices, smoothing volatility without losing the connection to the market.67
Figure 6. Settlement under a CCfD with a fixed trajectory reference price68
Strike prices can be adjusted over time for inflation to reduce the risk to projects of payments falling below real costs. The Netherlands CCfD69, Denmark’s CCUS Fund70, and the UK ICC Contract71 apply general inflation indexation to bids or operational payments to some extent. France’s CCfD makes no inflation provision, leaving projects to factor that risk into their own bid. Germany’s CCfD indexes the strike price to specified energy inputs instead, recognising that energy prices can move faster and more sharply than general inflation and that energy is the dominant operating cost for pathways replacing fossil fuels with clean electricity or hydrogen.72 A published energy market index is used for electricity, and a cost-based proxy is used for hydrogen, with a contractual right to revise as hydrogen markets develop. Each approach places inflation risk differently. Leaving it with the project keeps the design simple, but pushes up bids, since unhedged risk is priced in. Indexing to general inflation protects against broad price increases, but not against the sharper energy price swings that dominate costs for electrification and hydrogen pathways. Indexing to energy input targets that risk directly, protecting the project’s viability, but exposing the public budget to unpredictable liabilities if energy prices spike.
To link public support to the risks that projects carry over a long contract, the IDB’s CCfD framework should:
- Adopt two-way settlement from commissioning, with surplus repaid to the IDB funding envelope and available for reuse in subsequent allocation rounds.
- Reference settlement to EU ETS prices rather than a pre-set administrative trajectory, so payments track the carbon costs projects face and follow the market over the contract.
- Index strike prices for general inflation, and for energy costs, where energy is the dominant operating cost, so payments keep pace with rising costs.
4.2.4. Creating the conditions for CCfD awards to reach financial close
Whether a CCfD award translates into an operational project depends on the auction design choices that shape what bids enter, what contract is awarded, and what happens between contract signature and FID. Germany’s first CCfD round used weighted multi-criteria scoring (subsidy intensity per product quantity and relative GHG reduction in the first five years); in Round 2, it was simplified to cost-efficiency alone. France’s CCfD applies a primarily cost-based ranking with two bonuses – projects demonstrating greater carbon intensity reduction by 2035 and Innovation Fund recipients, recognising future trajectory and EU-level project quality alongside near-term cost.
When qualification is based solely on cost, under-prepared bids can win on price but fail to deliver if cost or financing assumptions no longer hold. Requiring projects to clear a maturity qualification at entry would raise the entry threshold, resulting in fewer but more credible bids and greater confidence that awarded projects can reach FID. Qualification also needs to consider whether the project has a credible pathway to long-term market viability. This filters out low-readiness bids while allowing the IDB to absorb the early-stage commercial risks that private capital cannot fully underwrite.
Additional safeguards can further reduce delivery risk. The Hydrogen Bank requires winning projects to post a completion guarantee that they will proceed with and complete the project if selected.73 Similar requirements apply in France’s CCfD, which uses guarantees and ex-post-performance penalties of its own. A cost attached to withdrawal raises the likelihood that awards go to developers who proceed to build. Set too high, such guarantees bear more heavily on smaller developers.
Even when projects enter the auction with a credible bid, the support structure must accommodate diverse financing needs across sectors. For most decarbonisation pathways, a CCfD covering the operating cost gap is sufficient to make a project financeable, since lenders can model debt service against the contracted revenue stream. For projects with high capital intensity and limited debt market depth, a single CCfD covering both capital and operating costs produces a strike price that commercially available financing cannot support, even where the underlying project economics are sound. The UK ICC Contract itself contains both a capex element (paid back over the first five years) and a smaller opex payment per tonne, illustrating the hybrid principle within a single bilaterally negotiated contract.
Contract duration also affects bankability, with a standard term across European schemes of 15 years from commissioning, long enough to support project financing while limiting the public authority’s commitment per project.74
A further challenge arises between the contract award and FID. Between contract signature and FID, construction costs can move materially as front-end engineering design (FEED) studies reveal the gap between bid-stage estimates and post-FEED cost build-up, leaving projects either to proceed at a strike price that no longer covers costs or to walk away and forfeit the bid bond. The UK ICC Contract handles this through bilateral negotiation, with the capital component agreed after FEED based on a detailed cost build-up — an approach a competitive auction cannot replicate without reopening price competition itself. A one-time revision window available between FEED completion and FID, with the cap and independent cost verification would treat cost movement as a contracted term within the original auction rather than as a post-award renegotiation.
To create the conditions for CCfD awards to reach financial close, the IDB’s CCfD framework could combine:
- Require a project maturity qualification at entry (engineering, legal, financial, and permitting readiness) and a credible pathway to long-term market viability, then rank those projects on bid price.
- Require bid bonds at submission and completion guarantees at FID, to discipline both bidding and delivery.
- A hybrid capital structure comprising capital grant disbursed against clear construction milestones, paired with a smaller long-term CCfD to stabilise ongoing operational costs, targeting projects with high capital intensity and limited debt market depth.
- A standard CCfD contract term of 15 years, long enough to support project financing while limiting the public authority’s commitment per project.
- A one-time strike price revision window between FEED completion and FID, subject to independent cost verification and capped at a maximum set in the contract.
4.3. Project Development Support as an Enabling Condition for Effective CCfDs
A competitive CCfD auction only delivers credible outcomes if bids are based on sufficiently mature engineering and cost estimates. A FEED study aims to produce a cost estimate with accuracy typically in the range of -20% to +30%75, requiring detailed engineering across process, mechanical, electrical, and instrumentation disciplines. The FEED study required to produce a bankable bid typically represents up to 5%76 of the total project cost, which, for a first-mover industrial decarbonisation project, can reach tens of millions of euros.
The IDB should therefore provide limited project development support that helps projects reach the maturity threshold required to enter the CCfD, making participation viable for a wider range of developers, while requiring a meaningful project sponsor contribution to align incentives, thereby broadening the pool of credible bidders without determining which projects win contracts.
Selection for development support does not guarantee that a project will win a CCfD; qualification in the main round applies equally to all bids. To widen the credible bid pool without weakening competition, the IDB’s development support framework should:
- Fund a capped share of FEED-equivalent engineering to enable credible CCfD bids.
5. Final Remarks
A coordinated Industrial Decarbonisation Bank that sequences project-development support and infrastructure selection ahead of the CCfD round, ties infrastructure capital release to CCfD-confirmed user-base commitments and handles cross-chain risk through CCfD contract provisions and prioritises funding for durable industrial assets is fundamental for converting EU funding into operating projects. Without this coordination, the next tranche of public support risks repeating the pattern visible across the Innovation Fund, where 208 signed grant agreements have produced 16 operating projects to June 2025.
However, the scale of investment required to decarbonise heavy industry, estimated at around €500 billion over the next 15 years for the four largest energy-intensive industries, sits well beyond the IDB’s €100 billion headline figure. Closing this gap requires mobilising Member State funding and private capital alongside the IDB. It also requires demand-side measures under the Industrial Accelerator Act to build the market for low-carbon products, and coordination with the EU electrification policy to ensure industrial sites can access long-term electricity contracts at competitive prices. Together, these elements would create the conditions that allow IDB-supported projects to operate sustainably beyond the contract period, rather than relying on indefinite revenue support.
The choices that the European Commission makes in the design of the IDB will determine whether the Bank delivers operating projects at scale or perpetuates the gap between allocation and delivery that has defined EU industrial decarbonisation programmes so far.
Footnotes
- European Environment Agency (2026) Greenhouse Gases — Data Viewer. Available at: https://www.eea.europa.eu/en/analysis/maps-and-charts/greenhouse-gases-viewer-data-viewers (Accessed: 2 April 2026).
- Åhman, M., Arens, M. and Vogl, V. (2024) Financing high-cost measures for deep emission cuts in the basic materials industry – Proposal for a value chain transition fund, Energy Policy, 192, 114236. Available at: https://www.sciencedirect.com/science/article/pii/S0301421524004336.
- Draghi, M. (2024) The Future of European Competitiveness: A Competitiveness Strategy for Europe. Brussels: European Commission, ch. 4, p. 54. Available at: https://commission.europa.eu/document/download/97e481fd-2dc3-412d-be4c-f152a8232961_en.
- European Scientific Advisory Board on Climate Change (2024) Towards EU Climate Neutrality: Progress, Policy Gaps and Opportunities, Assessment Report 2024, pp. 81–82. Available at: https://op.europa.eu/en/publication-detail/-/publication/163b269d-dc30-11ee-b9d9-01aa75ed71a1/language-en.
- CATF (2025) Systemic Bankability Is the Key to Unlocking Energy Transition Speed and Scale. Available at: https://www.catf.us/resource/systemic-bankability-is-the-key-to-unlocking-energy-transition-speed-and-scale/.
- European Commission (2025) The Clean Industrial Deal: A Joint Roadmap for Competitiveness and Decarbonisation, COM(2025) 85 final. Brussels: European Commission. Available at: https://eur-lex.europa.eu/legal-content/EN/TXT/?uri=CELEX:52025DC0085.
- CATF analysis, drawn from the documented design of each instrument.
- European Commission Innovation Fund Overview. Available at: https://commission.europa.eu/funding-tenders/find-funding/eu-funding-programmes/innovation-fund_en (Accessed: March 2026).
- CATF analysis.Based on data from European Commission, Innovation Fund Dashboard, available at: https://dashboard.tech.ec.europa.eu/qs_digit_dashboard_mt/public/sense/app/6e4815c8-1f4c-4664-b9ca-8454f77d758d/sheet/bac47ac8-b5c7-4cd1-87ad-9f8d6d238eae/state/analysis (Accessed: March 2026); and European Commission, Innovation Fund Projects Portal, available at: https://climate.ec.europa.eu/eu-action/eu-funding-climate-action/innovation-fund/innovation-fund-projects_en (Accessed: March 2026).
- European Commission (2026) Commission Reply to ECA Special Report 11/2026. Available at: https://www.eca.europa.eu/Lists/ECAReplies/COM-Replies-SR-2026-11/COM-Replies-SR-2026-11_EN.pdf (Accessed: March 2026).
- European Court of Auditors (2026) Special Report 11/2026: Innovation Fund – High potential, but slow progress and little impact on emissions reduction, 19 March, paras. 32, 38, 42 and 43. Available at: https://www.eca.europa.eu/en/publications/SR-2026-11 (Accessed: March 2026). Note: Covers 208 signed grant agreements to June 2025; figures are not directly comparable to the CATF analysis figures but are directionally consistent.
- European Commission (2025) 2025 Annual Knowledge Sharing Report of the Innovation Fund. Luxembourg: Publications Office of the European Union. Available at: https://op.europa.eu/en/publication-detail/-/publication/1ba2af02-62be-11f0-bf4e-01aa75ed71a1/language-en (Accessed: March 2026).
- CATF (2025), Funding Carbon Capture and Storage in Central and Eastern Europe: Strategies for Cost-Effective Deployment https://cdn.catf.us/wp-content/uploads/2025/09/15050506/CATF-Funding-CCS-in-CEE.pdf
- Regulation (EU) 2022/869 of the European Parliament and of the Council of 30 May 2022 on guidelines for trans-European energy infrastructure (TEN-E Regulation). Available at: https://eur-lex.europa.eu/eli/reg/2022/869/2025-02-05/eng (Accessed: March 2026). Regulation (EU) 2021/1153 of the European Parliament and of the Council of 7 July 2021 establishing the Connecting Europe Facility (CEF Regulation). Available at: https://eur-lex.europa.eu/eli/reg/2021/1153/oj (Accessed: March 2026).
- CATF (2025) Building Future-Proof CO₂ Transport Infrastructure in Europe. Available at: https://cdn.catf.us/wp-content/uploads/2025/02/13094818/CATF_CO₂TransportInfrastructure_Report_Proof_08.07.25.pdf
- Cement Europe (2024) From ambition to deployment.
- CATF analysis. Electrification cost estimates based on Schoeneberger, C., Dunn, J.B. and Masanet, E. (2024) Technical, Environmental, and Economic Analysis Comparing Low-Carbon Industrial Process Heat Options in U.S. Poly(vinyl chloride) and Ethylene Manufacturing Facilities. Environmental Science & Technology. Available at: https://pubs.acs.org/doi/10.1021/acs.est.3c05880. Blue hydrogen cost estimates assume ~150 kt/y blue hydrogen plant per 500 kt/y ethylene cracker (500 MWth furnace)
- CATF analysis based on NETL (2023) Cost of capturing CO₂ from industrial sources. Assume ~1 Mt/y capture facility per 500 kt/y ethylene cracker.
- European Commission, Joint Research Center, Tumara, D., Uihlein, A. and Hidalgo Gonzalez, I., Shaping the future CO₂ transport network for Europe, Publications Office of the European Union, 2024. https://publications.jrc.ec.europa.eu/repository/handle/JRC136709
- https://ehb.eu/newsitem/european-hydrogen-backbone-grows-to-meet-repowereu-s-2030-hydrogen-targets
- Endrava (2026) CaptureMap. Available at: https://www.capturemap.no/ (Accessed: April 2026).
- Range covers DRI-EAF + CCS (lower bound) to Green H₂ DRI + EAF (upper bound). CATF analysis based on carbon intensities from IEAGHG (2024) Clean Steel: An Environmental and Technoeconomic Outlook of a Disruptive Technology, Technical Report 2024-02, available at: https://publications.ieaghg.org/technicalreports/2024-02%20Clean%20Steel%20An%20environmental%20and%20technoeconomic%20outlook%20of%20a%20disruptive%20technology.pdf ; and DRI cost data from BloombergNEF (2024) Direct Reduction-Grade Iron Ore: A Green Steel Bottleneck, 18 April 2024.
- Based on a 2 Mt of crude steel DRI project and per-tonne capex ranges from IEAGHG (2024) Clean Steel: An Environmental and Technoeconomic Outlook of a Disruptive Technology, Technical Report 2024-02, available at: https://publications.ieaghg.org/technicalreports/2024-02%20Clean%20Steel%20An%20environmental%20and%20technoeconomic%20outlook%20of%20a%20disruptive%20technology.pdf (low) and Clean Air Task Force (2024) Decarbonization Pathways and Policy Recommendations for the United States Steel Sector, available at: https://www.catf.us/resource/decarbonization-pathways-policy-recommendations-united-states-steel-sector/ (high). Excludes H₂ production, CO₂ infrastructure, and electricity infrastructure costs.CATF (2025) The Role for Carbon Capture and Storage in Decarbonising Europe’s Cement Sector. Available at: https://www.catf.us/resource/role-carbon-capture-storage-decarbonising-europes-cement-sector/
- Based on a project capturing 1 Mtpa CO₂ and a capex range of ~€350-700/tpa CO₂, based on NETL (2023) Cost of capturing CO₂ from industrial sources and ECRA (2022) Technology Papers. Excludes CO₂ infrastructure costs.
- Assumes steam cracker post-combustion capture costs are comparable to cement.
- CATF analysis based on ~€1.5 bn per cracker for electrification or blue H₂; ~€0.35 bn per facility for post-combustion capture.
- CATF (2024). Refinery of the future – decarbonisation options. Available at: https://www.catf.us/resource/refinery-of-the-future/
- Pathway-specific abatement cost ranges drawn from Ferreira de Almeida, V., Tejedor Sanz, S. and Moya, J. (2026) Mapping the Transition of the EU Pulp and Paper Industry to Carbon Neutrality, Joint Research Centre, available at: https://publications.jrc.ec.europa.eu/repository/handle/JRC144089; Johnsson, F., Normann, F. and Svensson, E. (2020) Marginal Abatement Cost Curve of Industrial CO₂ Capture and Storage – A Swedish Case Study, Frontiers in Energy Research, 8, 175, available at: https://www.frontiersin.org/journals/energy-research/articles/10.3389/fenrg.2020.00175/full; and Karlsson, S., Normann, F. and Johnsson, F. (2024) Cost-optimal CO₂ capture and transport infrastructure – A case study of Sweden’ International Journal of Greenhouse Gas Control, 132, 104055, available at: https://www.sciencedirect.com/science/article/pii/S1750583623002244. The JRC document has a narrower CCS cost range of 62–120 €/tCO₂.
- This count includes 5 UK projects and 3 Norwegian projects, with only 4 FIDs taken in the EU. The Porthos project (counted here as a single project) comprises storage and 6 separately funded capture projects across 4 sites.
- CATF (2025) Funding Carbon Capture and Storage in Central and Eastern Europe: Strategies for Cost-Effective Deployment. Available at: https://cdn.catf.us/wp-content/uploads/2025/09/15050506/CATF-Funding-CCS-in-CEE.pdf
- Swedish Energy Agency (2025) SEK 20 billion to Capture and Store Over 11 million Tons of Biogenic Carbon Dioxide. Available at: https://www.energimyndigheten.se/en/news/2025/20-billion-to-capture-and-store-over-11-million-tons-of-biogenic-carbon-dioxide/
- European Climate, Infrastructure and Environment Executive Agency (CINEA) BECCS Stockholm: Delivering Net Carbon Removals with Clean Energy. Available at: https://cinea.ec.europa.eu/featured-projects/beccs-stockholm-delivering-net-carbon-removals-clean-energy_en?
- European Investment Bank (2025) Sweden: EIB Finances Ground-Breaking Carbon Capture Plant in Stockholm, Press release 2025-172. Available at: https://www.eib.org/en/press/all/2025-172-eib-finances-ground-breaking-carbon-capture-plant-in-stockholm?
- Stockholm Exergi (2025) Stockholm Exergi Extends Landmark Carbon Removal Agreement with Microsoft. Available at: https://www.stockholmexergi.se/nyheter/stockholm-exergi-extends-landmark-carbon-removal-agreement-with-microsoft/
- Offshore Energy (2025) Two Final Bids in the Run for Denmark’s €3.84 Billion Carbon Capture and Storage Fund. Available at: https://www.offshore-energy.biz/two-final-bids-in-the-run-for-denmarks-e3-84-billion-carbon-capture-and-storage-fund/
- Supporting this infrastructure expansion necessitates significant funding scale-up: the Connecting Europe Facility (CEF) is proposed to increase five-fold from €5.8 billion to €29.9 billion for the 2028-2034 period. However, given total grid investment needs estimated at €1.2 trillion until 2040 – including €730 billion for distribution grids alone, public funding alone cannot bridge the financing gap. European Commission (2025) European Grids Package, COM(2025) 1005 final, 10 December. Brussels: European Commission. Available at: https://eur-lex.europa.eu/legal-content/EN/TXT/?uri=CELEX:52025DC1005
- CATF (2025) Hydrogen in EU Industry: Decarbonising Existing Hydrogen Production and Consumption in the EU 27. Available at: https://www.catf.us/resource/hydrogen-in-eu-industry/
- Directive (EU) 2023/2413 of the European Parliament and of the Council of 18 October 2023 (REDIII), Article 22a. Available at: https://eur-lex.europa.eu/eli/dir/2023/2413/oj/eng
- CATF Analysis
- European Hydrogen Observatory, Hydrogen production, trade and cost. Available at: https://observatory.clean-hydrogen.europa.eu/hydrogen-landscape/production-trade-and-cost/hydrogen-production
- European Commission, DG CLIMA (2025) Innovation Fund Expert Group Meeting Presentations, 13 November. Brussels: European Commission. Available at: fd9a1320-179e-435a -b0c4-47330d9dd909_en
- CATF (2023) Techno-economic Realities of Long-Distance Hydrogen Transport: A Cost Analysis of Importing Low-Carbon Hydrogen to Europe. Available at:https://www.catf.us/resource/techno-economic-realities-long-distance-hydrogen-transport/
- European Commission (2025) Proposal for a Regulation of the European Parliament and of the Council establishing a framework of measures for the acceleration of industrial capacity and decarbonisation in strategic sectors and amending Regulations (EU) 2018/1724, (EU) 2024/1735 and (EU) 2024/3110. Brussels: European Commission. Available at: 9bc8eb85-4d43-4025-be7b-c86b9f3648ec_en
- Agence de la transition écologique (2026) Appel d’offres Grands projets industriels de décarbonation 2026 (Call for tenders for major industrial decarbonisation projects 2026). Angers: ADEME. Available at: agirpourlatransition.ademe.fr
- CATF (2025) Building Future-Proof CO₂ Transport Infrastructure in Europe. Available at: CATF_CO₂TransportInfrastructure_Report_Proof_08.07.25.pdf
- Bundesministerium für Wirtschaft und Energie (2026) Förderaufruf zum zweiten Gebotsverfahren für Klimaschutzverträge (Funding call for the second auction round of Carbon Contracts for Difference). Berlin: BMWE. Available at: CCfD-GV2026_Förderaufruf.pdf
- Department for Energy Security and Net Zero (2025) Carbon capture, usage and storage: Industrial Carbon Capture Business Models Update, November 2025. London: DESNZ. Available at: Industrial_Carbon_Capture_Business_Models_Update.pdf
- CATF (2025) Building Future-Proof CO₂ Transport Infrastructure in Europe. Available at: CATF_CO₂TransportInfrastructure_Report_Proof_08.07.25.pdf
- European Investment Bank (2025) Pan-EU Power Purchase Agreement Guarantee Lending Envelope, project pipeline reference 20250202. Available at: https://www.eib.org/en/projects/pipelines/all/20250202.
- Council of the European Union (2025) Tripartite agreements for affordable energy for EU’s industry – state of play, Information Note 13857/25, 14 October. Available at: https://data.consilium.europa.eu/doc/document/ST-13857-2025-INIT/en/pdf
- European Commission (2023) Communication on the European Hydrogen Bank, COM(2023) 156 final, 16 March; see also Innovation Fund IF25 Hydrogen Auction launched November 2025, available at https://climate.ec.europa.eu/eu-action/eu-funding-climate-action/innovation-fund/calls-proposals/if25-hydrogen-auction_en
- CATF (2024), Designing Carbon Contracts for Difference: A comparison of incentives for carbon capture and storage in Europe, https://www.catf.us/resource/designing-carbon-contracts-for-difference/
- Bundesministerium für Wirtschaft und Energie (2026) Förderaufruf zum zweiten Gebotsverfahren für Klimaschutzverträge (Funding call for the second auction round of Carbon Contracts for Difference). Berlin: BMWE. Available at: CCfD-GV2026_Förderaufruf.pdf
- Agence de la transition écologique (2026) Appel d’offres Grands projets industriels de décarbonation 2026 (Call for tenders for major industrial decarbonisation projects 2026). Angers: ADEME. Available at: agirpourlatransition.ademe.fr
- Planbureau voor de Leefomgeving (2025) Eindadvies basisbedragen SDE++ 2025. Available at: https://www.pbl.nl/publicaties/eindadvies-basisbedragen-sde-2025
- The Innovation Fund applies a comparable logic, calculating emissions avoided against reference scenarios that are, for most sectors, prescribed by its methodology rather than set by the applicant. European Commission (2026) InnovFund GHG Emission Avoidance Methodology, V5.1, 15 January 2026. Available at: https://ec.europa.eu/info/funding-tenders/opportunities/docs/2021-2027/innovfund/guidance/ghg-emission-avoidance-methodology_innovfund_en.pdf
- Denmark (CCUS and CCS Funds) and the UK (Industrial Carbon Capture Contracts) run CCfD for carbon capture alone, rather than across all pathways. The EU’s separate competitive support for renewable hydrogen and for industrial heat runs as fixed-premium auctions, paying a flat amount per unit rather than the sliding difference against a carbon price that defines a CCfD.
- Fraunhofer ISI and Guidehouse (2022) Options for a competitive bidding mechanism for a demand-side instrument under the Innovation Fund. Input paper for workshop. Available at: https://climate.ec.europa.eu/system/files/2023-08/innovationfund_inputpaperforworkshop_en.pdf
- Since 2023 the SDE++ has reserved budget for three technology domains — low-temperature heat, high-temperature heat, and molecules – through ring-fences (“hekjes”); in 2025 these totalled €750 million, and budget not taken up within a ring-fence reverts to the open round and competes on subsidy intensity. Available at: https://www.rvo.nl/sites/default/files/2025-09/Brochure-SDE2025.pdf.
- Direction générale des Entreprises (2025) Sept projets lauréats de l’appel d’offres Grands Projets Industriels de Décarbonation. Available at: Sept projets lauréats de l’appel d’offres « Grands Projets Industriels de Décarbonation » | Direction générale des Entreprises
- Blömer, R.A. (2025) Challenges in designing an industrial decarbonization support scheme: Insights from the German CCfD scheme. Papeles de Energía, No. 29, Funcas.
- Rijksdienst voor Ondernemend Nederland (2025) Stimulering Duurzame Energieproductie en Klimaattransitie (SDE++) 2025 — Brochure. Available at: https://english.rvo.nl/sites/default/files/2024-09/BrochureSDE2025English.pdf
- Bundesministerium für Wirtschaft und Energie (2026) Förderaufruf zum zweiten Gebotsverfahren für Klimaschutzverträge (Funding call for the second auction round of Carbon Contracts for Difference). Berlin: BMWE. Available at: https://www.CO₂-differenzvertraege.info/lw_resource/datapool/systemfiles/agent/ewbpublications/9679e7ec-4850-11f1-a167-fa163ed847d2/live/document/CCfD-GV2026_F%C3%B6rderaufruf.pdf
- Reviewing the SDE++ contracts behind Porthos, the Netherlands Court of Audit found that as the CO₂ price rises the benefit accrues largely to the participating companies while the State, carrying long-term risk, does not share proportionally. Netherlands Court of Audit (Algemene Rekenkamer) (2024) Carbon storage under the North Sea, 28 March. https://english.rekenkamer.nl
- Agence de la transition écologique (2026) Appel d’offres Grands projets industriels de décarbonation 2026 (Call for tenders for major industrial decarbonisation projects 2026). Angers: ADEME. Available at: agirpourlatransition.ademe.fr
- Bundesministerium für Wirtschaft und Energie (2026) Förderaufruf zum zweiten Gebotsverfahren für Klimaschutzverträge (Funding call for the second auction round of Carbon Contracts for Difference). Berlin: BMWE. Available at: https://www.CO₂-differenzvertraege.info/lw_resource/datapool/systemfiles/agent/ewbpublications/9679e7ec-4850-11f1-a167-fa163ed847d2/live/document/CCfD-GV2026_F%C3%B6rderaufruf.pdf
- CATF analysis. The fixed trajectory reference price shown reflects setting the reference price in advance rather than tracking the ETS price, as used in France’s CCfD. Available at: https://agir.ademe.fr/aides-financieres/aap/appel-doffres-grands-projets-industriels-de-decarbonation-2024. Whether the project repays the counterparty under a two-way CCfD when the reference price is below the strike price, or payment stops under a one-way CCfD, varies across implemented schemes. Available at: https://www.catf.us/resource/designing-carbon-contracts-for-difference/. Divergence cases shown are illustrative.
- Rijksdienst voor Ondernemend Nederland (2025) Stimulering Duurzame Energieproductie en Klimaattransitie (SDE++) 2025 — Brochure. Available at: https://english.rvo.nl/sites/default/files/2024-09/BrochureSDE2025English.pdf
- Danish Energy Agency (2025) CCUS Fund — tender materials and launch, Energistyrelsen, January. Available at: https://ens.dk/en/supply-and-consumption/ccs-tenders-and-other-funding-ccs-development
- Department for Energy Security and Net Zero (2025) Carbon capture, usage and storage: Industrial Carbon Capture Business Models Update, November 2025. London: DESNZ. Available at: Industrial_Carbon_Capture_Business_Models_Update.pdf
- Bundesministerium für Wirtschaft und Energie (2026) Förderaufruf zum zweiten Gebotsverfahren für Klimaschutzverträge (Funding call for the second auction round of Carbon Contracts for Difference). Berlin: BMWE. Available at: https://www.CO₂-differenzvertraege.info/lw_resource/datapool/systemfiles/agent/ewbpublications/9679e7ec-4850-11f1-a167-fa163ed847d2/live/document/CCfD-GV2026_F%C3%B6rderaufruf.pdf
- European Commission (2023) Communication on the European Hydrogen Bank, COM(2023) 156 final, 16 March; see also Innovation Fund IF25 Hydrogen Auction launched November 2025, available at https://climate.ec.europa.eu/eu-action/eu-funding-climate-action/innovation-fund/calls-proposals/if25-hydrogen-auction_en
- The UK ICC uses 10-15 years; Denmark’s first-phase CCUS Fund (2022-2023) used 20-year contracts to reflect the longer asset life of large-scale infrastructure but was shortened to 15 years when the scheme was restructured as the CCS Fund in 2024.
- FEED-level engineering corresponds to an AACE Class 3 estimate, with an expected accuracy range of −20% to +30% (−20% to −10% on the low side, +10% to +30% on the high side), widening with project complexity and level of definition. Ranges are asymmetric, with larger variation on the high-cost side. Gallerani, J. (2023) The cost estimating series: capital cost estimate classes, Integrated Technologies, Inc. Available at: https://www.processengineer.com/insights/capital-cost-estimate-classes (Accessed: 21 April 2026)
- The figure originates from CCS project experience, FEED-level engineering effort is broadly comparable across first-mover industrial decarbonisation projects. CCS Knowledge Centre (2020) The need for FEED. Available at: https://ccsknowledge.com/wp-content/uploads/2025/01/The-NEED-for-FEED.pdf (Accessed: 21 April 2026).
Featured in the Media
€100 Billion Funding Scheme: This Is How the Industrial Decarbonisation Bank Could Look | Tagesspiegel Background
EU urged to turn €100 bln Industrial Decarbonisation Bank into project delivery machine | Carbon Pulse
Table 5. List of abbreviations
| Abbreviation | Full term |
|---|---|
| ADEME | Agence de la transition écologique (French Agency for Ecological Transition) |
| BECCS | Bioenergy with carbon capture and storage |
| BF-BOF | Blast furnace-basic oxygen furnace |
| Capex | Capital expenditure |
| CCfD | Carbon Contract for Difference |
| CCS | Carbon capture and storage |
| CCUS | Carbon capture, utilisation and storage |
| CDR | Carbon dioxide removal |
| CEF | Connecting Europe Facility |
| CEIS | Clean Energy Investment Strategy |
| CINEA | European Climate, Infrastructure and Environment Executive Agency |
| CO₂ | Carbon dioxide |
| DRI-EAF | Direct reduced iron-electric arc furnace |
| ECA | European Court of Auditors |
| EIB | European Investment Bank |
| EU | European Union |
| EU ETS | European Union Emissions Trading System |
| FEED | Front-end engineering design |
| FID | Final investment decision |
| GPID | Grands Projets Industriels de Décarbonation |
| IAA | Industrial Accelerator Act |
| IDB | Industrial Decarbonisation Bank |
| MRV | Monitoring, reporting and verification |
| Opex | Operating expenditure |
| PCI/PMI | Project of Common Interest / Project of Mutual Interest |
| PPA | Power Purchase Agreement |
| PSA | Pressure swing adsorption |
| RED | Renewable Energy Directive |
| RFNBO | Renewable fuel of non-biological origin |
| SDE++ | Stimulering Duurzame Energieproductie en Klimaattransitie |
| SII | Strategic infrastructure investment |
| T&S | Transport and storage |
| TEN-E | Trans-European Networks for Energy |
| UK ICC | UK Industrial Carbon Capture (contract) |
| WACC | Weighted average cost of capital |

