
Assessment of Decarbonization Pathways for California’s Cement Sector
Introduction
California’s economy and climate goals put the state at the forefront of deep decarbonization efforts, having committed to achieving carbon neutrality no later than 2045 and reducing statewide anthropogenic greenhouse gas emissions at least 85% below 1990 levels by that date, as codified in AB-1279 (The California Climate Crisis Act).
These long-term targets are operationalized through interim goals and sector-specific strategies set forth in CARB’s Scoping Plan and implemented through complementary statutes, regulations, and executive directives. Decarbonizing the industrial sector—one of the state’s largest sources of remaining emissions—is essential to meeting these commitments and will require sustained, deep reductions over the coming decades.
In 2021, the California Legislature passed SB 596, directing the California Air Resources Boad (CARB) to develop a comprehensive strategy for the cement sector to achieve a reduction in greenhouse gas (GHG) intensity of 40% below 2019 levels (baseline) by 2035, and net-zero GHG emissions by 2045 for cement used in the state. CARB has produced a draft Net-Zero GHG Emissions Strategy for the Cement Sector (“Draft SB 596 Strategy”)1 that lays out the technical pathways and policy options to meet those statutory targets. These technical pathways include clinker reduction and use of supplementary cementitious materials (SCMs), electrification, fuel switching, and carbon capture and storage (CCS).
One issue for cement is that the sector’s CO2 emissions are mostly process-related (from limestone calcination) rather than combustion-related, meaning electrification alone cannot fully decarbonize the sector. Achieving deep decarbonization of the cement sector in California will require deployment of multiple technologies, though the exact mix of technologies remains unclear. Multiple decarbonization pathways must be advanced in parallel to achieve SB 596 reduction targets.
This report examines four decarbonization pathways for California cement plants with an emphasis on fuel switching, SCMs to produce blended cements, electrification, and CCS. These technologies are highlighted in the Draft SB 596 Strategy as key cement decarbonization levers and technology options.2,3 High-level carbon abatement costs and emissions impacts are estimated for four unique decarbonization pathways:
- Pathway 1: CCS only
- Pathway 2: Electrification + CCS
- Pathway 3: Blended Cement + CCS
- Pathway 4: Blended Cement + Alternative Fuels + CCS
The purpose of this analysis is to determine cost and GHG emissions reduction potential of four decarbonization pathways for cement plants to better characterize the current cost-gap these technologies face and to evaluate tradeoffs between the pathways. This report also includes a qualitative assessment of the non-GHG emissions impacts of these technologies and the decarbonization pathways. CATF published a companion report, “Cementing California’s Future: Policy Recommendations for Decarbonizing California’s Cement Sector,” that builds off this technical analysis and provides policy recommendations for a holistic framework for cement sector decarbonization, air quality improvements, and industrial innovation.
Executive Summary
CATF contracted Synapse Energy Economics to conduct a comparative techno-economic analysis of four decarbonization pathways relative to a baseline scenario, each of which relies on carbon capture and storage (CCS) to abate residual emissions for a representative cement facility in California: installation of CCS only (Pathway 1), full electrification of the precalciner and kiln with CCS (Pathway 2), limestone calcined clay cement production with CCS (Pathway 3), and limestone calcined clay cement (LC3) production and increased alternative fuel use with CCS (Pathway 4). The baseline scenario assumes the cement plant continues to use conventional technology while installing a new rotary kiln. Pathways 1, 3, and 4 model amine-based post-combustion CCS systems, while Pathway 2 models a compression and purification unit that captures process emissions from the electrified equipment.4
The purpose of the modeling was to generate high-level cost and CO2 emissions estimates that would allow for evaluating tradeoffs between the pathways. The purpose of Pathway 1 is to examine the impact of retrofitting an existing cement plant with CCS, without any additional changes to cement production processes, while Pathways 2, 3, and 4 utilize CCS to abate residual emissions following the application of other decarbonization strategies available to the cement sector. Focusing on the specific technologies in the pathways allows for better exploration of the barriers to entry. Furthermore, the pathways were chosen due to their feasibility for uptake by industry. For example, elements of Pathway 4 are already being explored as a viable option for National Cement’s Lebec Net-Zero Project located in Lebec, California.5 CCS is included in each pathway because it is necessary for long-term decarbonization of the cement industry, especially to address process CO2 emissions inherent to clinker production.6
Key findings from the modeling include the following:
- All four pathways offer substantial CO2 emissions reductions relative to the baseline scenario starting in 2028, the year the equipment begins operating. Pathway 1 reduces year 1 cement emissions intensity by 84%, Pathway 2 by 72%, and Pathways 3 and 4 by 89%. These reductions increase over time as the electricity supply in California decarbonizes7—especially in Pathway 2, where an additional 20% reduction brings the pathway to a final 92% reduction relative to the baseline by 2050. Pathways 1, 3, and 4 each decrease an additional 4% relative to the baseline by 2050.
- Pathways 3 and 4 have the lowest lifetime carbon abatement cost at around $100 per metric ton (t) of CO2 (2024$), largely driven by adoption of LC3, which uses 44% less clinker per metric ton of cement than ordinary Portland cement (OPC). Pathway 2 has the highest lifetime carbon abatement cost at $479 per t CO2 (2024$), mainly due to high energy costs from electrification.8 The abatement cost of Pathway 1 is $182 per t CO2 (2024$), which is partway between the cost of Pathway 2 and those of Pathways 3 and 4.
- Energy costs dominate increases in lifetime costs relative to the baseline of $63 per metric ton of cement ($2024), ranging from 40% of a $70 increase per metric ton of cement in Pathways 3 & 4 to 87% of a $302 increase per metric ton of cement in Pathway 2. Capital costs range from $155–$275 million (2024$) in the decarbonization pathways, compared to $24 million (2024$) in the baseline.9 Capital costs — including the flue gas pre-treatment required for amine-based CCS pathways — remain a minor share of levelized cement costs (up to 17% in Pathway 1) and lifetime abatement costs (up to 25% in Pathways 3 & 4). By contrast, both levelized cement costs and lifetime abatement costs are mainly driven by differences in energy and carbon transport and storage costs across the pathways.
- The energy penalty for amine-based CCS nearly doubles the energy required to produce one metric ton of cement in Pathway 1 relative to the baseline (87% increase), and it also increases the energy intensity of cement in Pathways 3 and 4 (26% increase) relative to the baseline. The increase in energy intensity is smaller in Pathways 3 and 4 because the substitution of calcined clay for a portion of the clinker partially offsets the energy intensity of the amine-based CCS system. Pathway 2 sees the smallest increase in energy intensity (13% increase) because it uses a compression and purification unit without the need for an amine-based CCS system to capture carbon dioxide. This is possible in Pathway 2 because the only on-site emissions are process CO2 emissions, about 90% of which are emitted from the precalciner in an essentially pure stream of CO2. This means the energy-intensive separation of CO2 from a mixed exhaust stream containing both process emissions and combustion emissions is unnecessary.
- Pathways 1, 3, and 4 generate, capture, and permanently sequester biogenic CO2 resulting from the combustion of partially or fully biogenic-based alternative fuels, including woody biomass, tires, and EMSW. Pathway 4 achieves net-zero or even net-negative emissions (Scope 1 and 2 only) under the assumption that permanently sequestered biogenic CO2 results in net-negative CO2 emissions, particularly as the Scope 2 emissions decrease towards 2050.10 In California, the cement industry has a distinct opportunity to deploy bioenergy with carbon capture and storage (BECCS), leveraging the state’s abundant woody biomass resources generated through planned forest fuel load reduction efforts to reduce wildfire impacts.11 Integrating BECCS at cement facilities using or expanding the use of biogenic-based alternative fuels might provide carbon dioxide removal (depending on a facility’s direct and indirect lifecycle emissions) while supporting cement decarbonization and forest management.12
- Modeling in this study does not include a quantitative analysis of the air quality impacts of the decarbonization pathways. Qualitatively, considering the combined impact of the factors above, all pathways would likely offer net air quality benefits:
- In Pathway 1, the addition of CCS will necessitate add-on pollution controls that will reduce SO2 and particulate matter (PM) emissions, as described above. Emissions of VOCs related to the amine-based solvent would likely increase slightly.13
- Full electrification in Pathway 2 eliminates on-site production of toxic air contaminants associated with fuel combustion. Process-related air emissions of PM and associated air toxics would still occur in this pathway.
- In Pathway 3, adoption of LC3 will also reduce thermal NOX, SO2, and PM by substituting calcined clay for a portion of the clinker. Finally, installation of amine-based CCS in this pathway will have similar impacts to Pathway 1; add-on pollution controls will offer deep reductions in SO2 and PM emissions, but VOC emissions may increase.
- Pathway 4 builds on the improvements from LC3 and CCS in Pathway 3. The shift from coal and petcoke to woody biomass and EMSW generally reduces SO2, NOX, and PM, if the alternative fuel and controls are well-managed.
Overview of Cement Plants in California
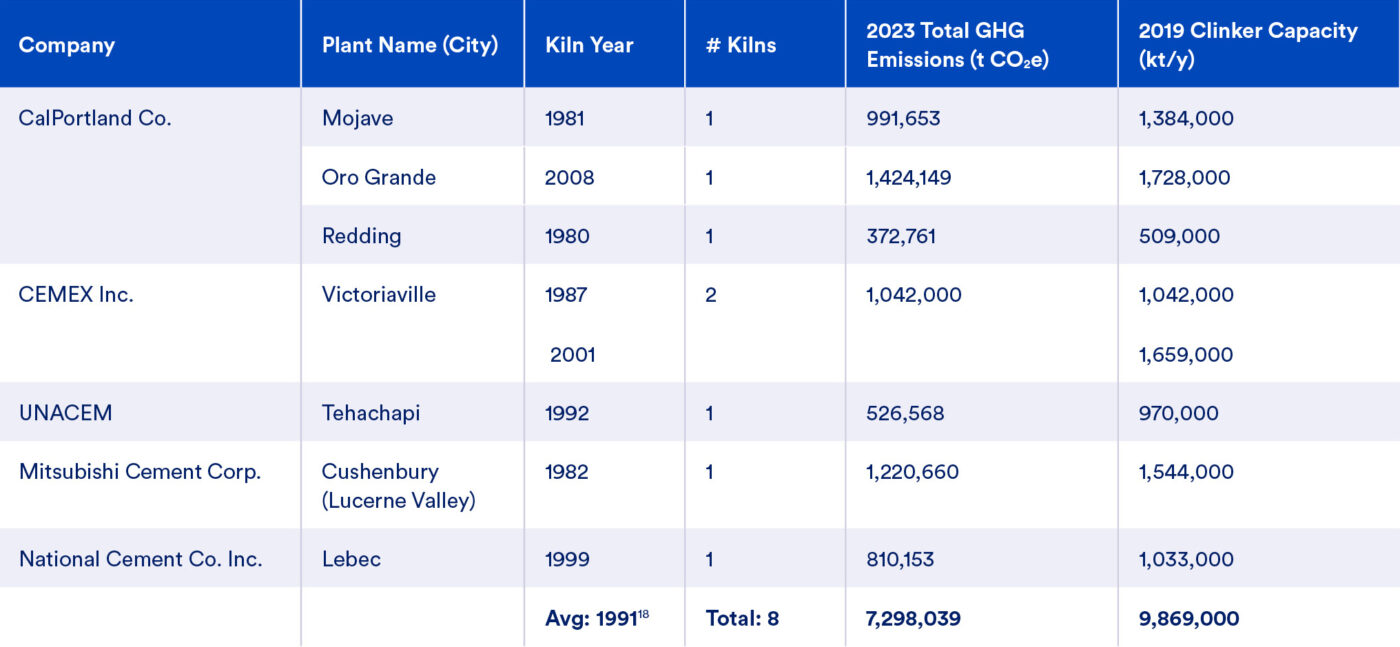
California is the second largest cement and clinker producing state in the U.S.,14 producing 11% of the nation’s clinker while operating at 79% capacity factor.15 The California cement sector is a major employer in the state with over 16,000 cement and related employees and payroll exceeding $1.1 billion in 2023.16 California’s cement industry dates to the late 19th century, with 7 plant currently operating.17 CalPortland’s Redding facility is in Northern California, and the remaining 6 facilities are in Southern California.
Figure 1: California Cement Plants by GHG Emissions
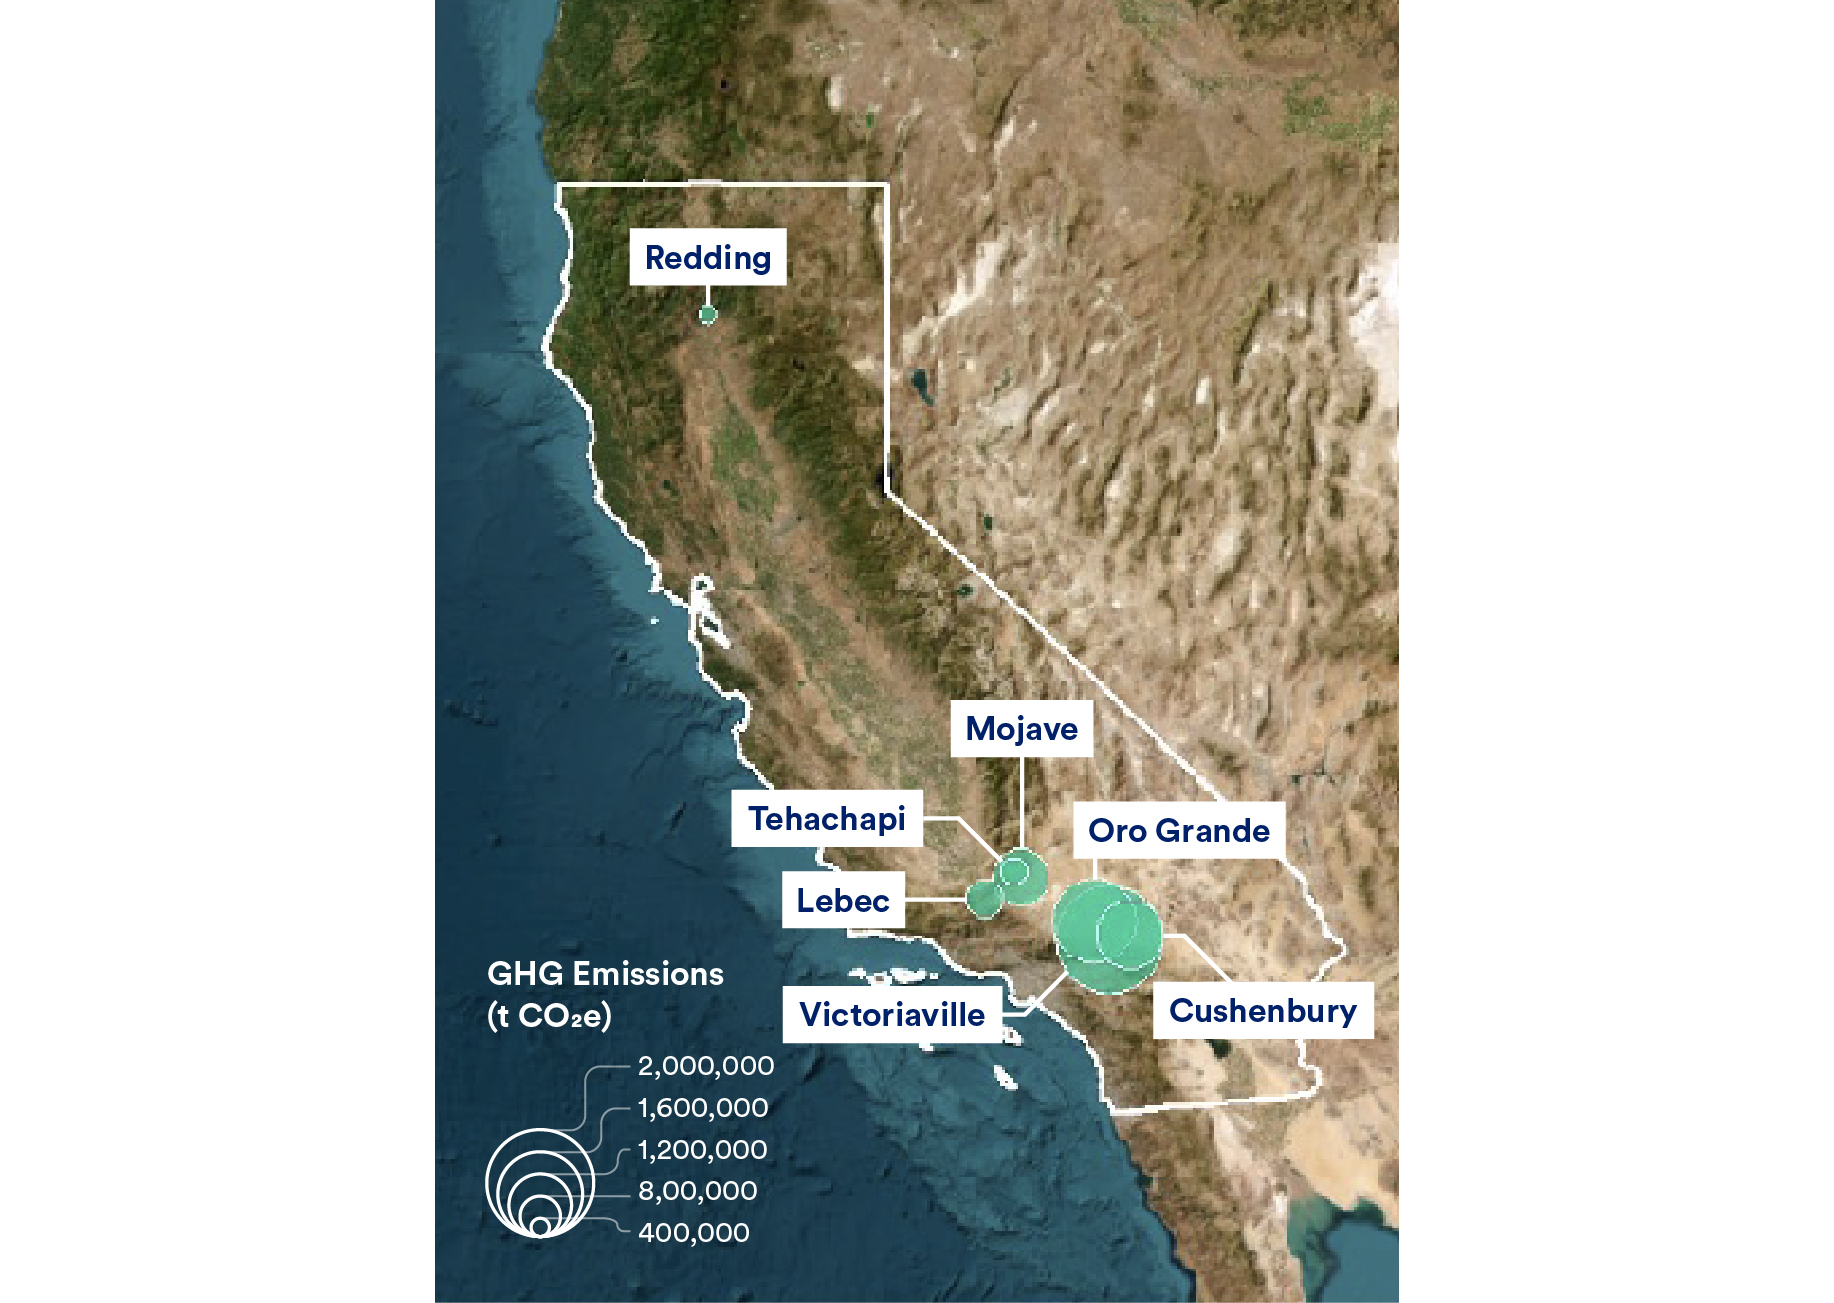
Table 1: Overview of California Cement Plants
The Emissions Problem
The California cement industry has significant greenhouse gas emissions, which contribute to about 2% of statewide emissions and 10% of state industrial emissions.19 60% of Scope 1 and 2 GHG emissions are process emissions, 37% are from combustion of fuels, and 3% are indirect emissions from electricity purchases. Total emissions and clinker production have remained relatively stable since 2014: around 8 Mt (million metric tons) CO2e and 9 Mt clinker.
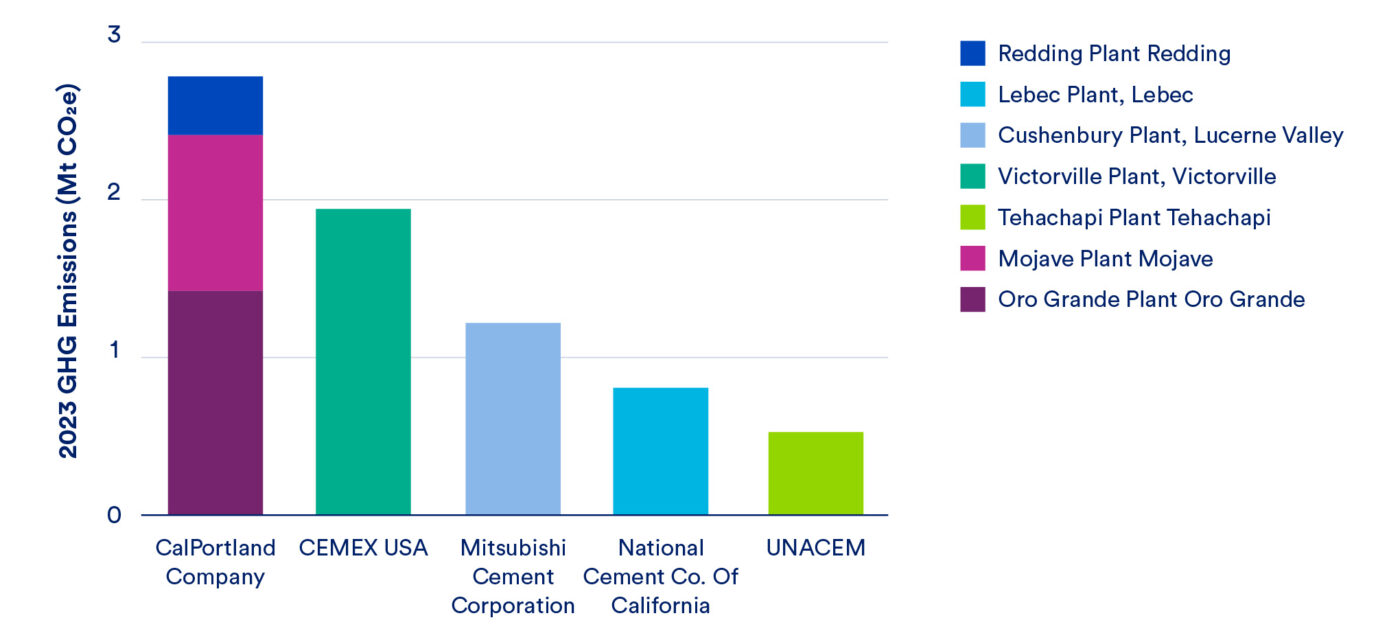
Figure 3 shows total annual GHG emissions from California’s cement plants by parent company, in order of descending total annual GHG emissions.
Figure 2: California Cement Sector Scope 1 and 2 GHG Emissions (Mt CO2e), 2019
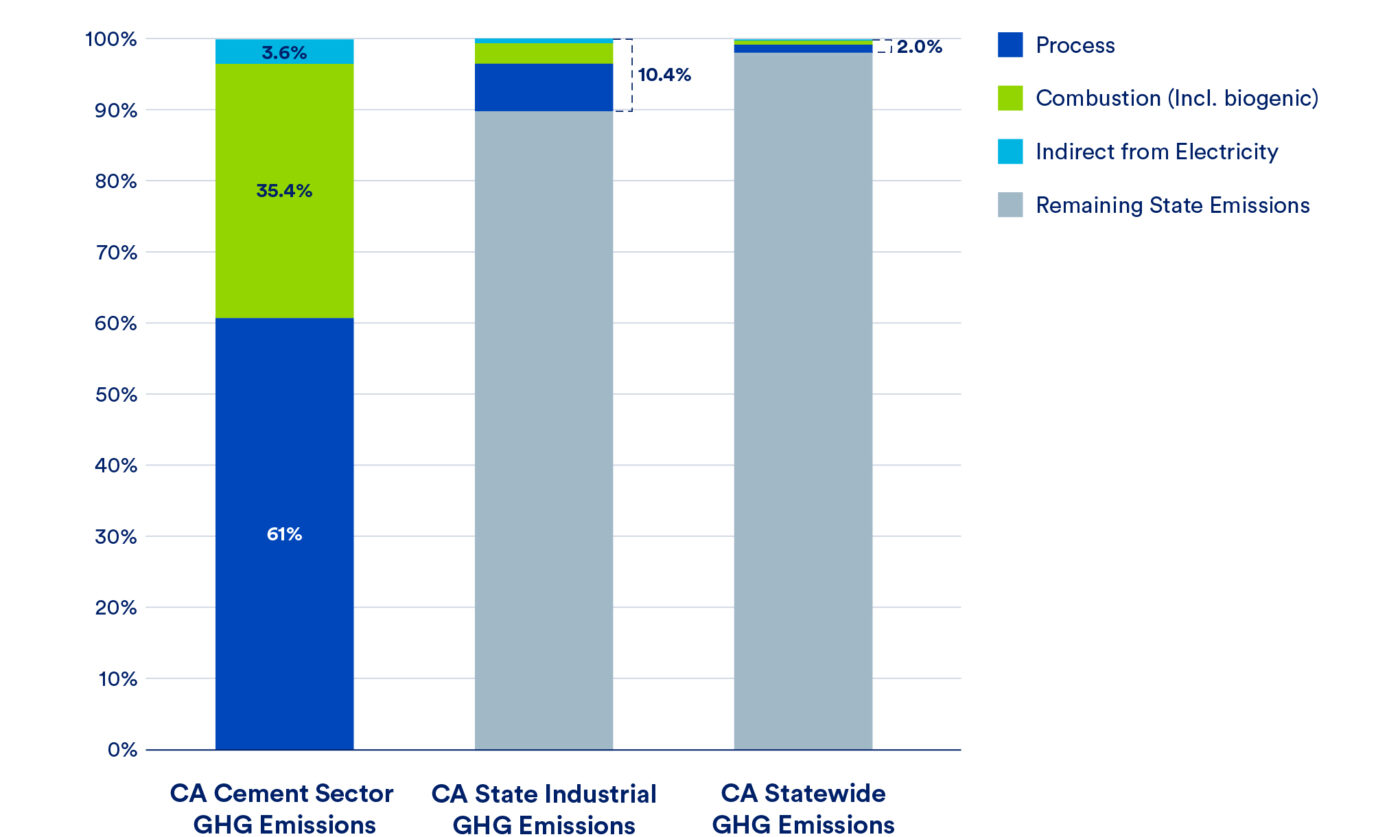
Figure 3: California Cement Plants GHG Emissions by Parent Company
Overview of the cement production process and associated emissions
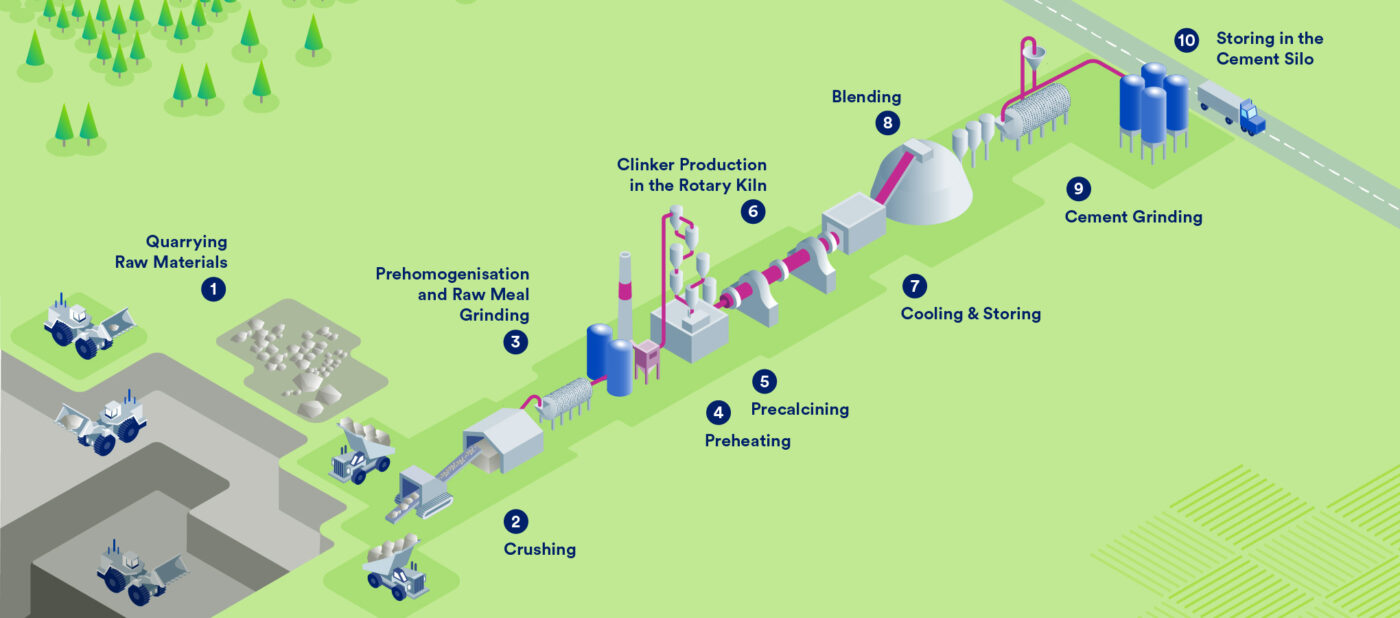
Cement production facilities have multiple process steps (Figure 4) that transform raw materials into cement, each with its own distinct energy and material inputs and associated emissions. Raw materials are transported from a quarry and prepared by grinding. They are then heated and fed into a rotary kiln where the material is transformed through chemical reactions to form clinker. Finally, the clinker is cooled, ground to form cement, and blended with other materials to form the final cement product.
The preheater and kiln generate the bulk of the plant’s total greenhouse gas emissions (greater than 99%20) due to the chemical calcination reaction, which decomposes limestone into calcium oxide (lime) and carbon dioxide (process emissions), and to the combustion of fuels, which provides the energy necessary for the reactions to take place (combustion emissions). These energy intensive processes transform raw materials into clinker and finally into cement by grinding the clinker and blending with additional material such as gypsum and limestone.
All of California’s seven plants operate a “dry” production process with a multi-stage preheater and precalciner combustion chamber—a configuration that is the most thermally efficient and is considered the state-of-the-art cement production technology.21 The Cemex plant operates two kilns, while the other 6 facilities operate one kiln each. Across all eight kilns, the average age is 35 years which is within the expected lifetime—usually 30-50 years.22
Figure 4: The production process chain in an integrated cement plant
Clinker carbon intensity trends
Individual plant clinker carbon intensity cannot be calculated with publicly available data because, while individual plant GHG emissions data is available from CARB, clinker production information is not publicly available. Only clinker capacity is publicly available.23
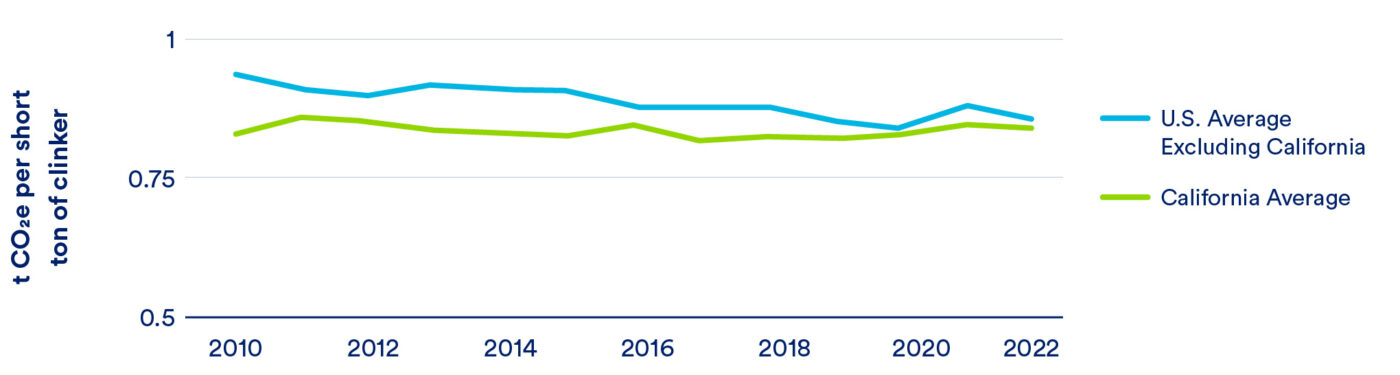
California-wide clinker carbon intensity can be calculated by dividing the annual GHG emissions (CO2e) by the total clinker production for a given year. California’s average clinker carbon intensity has been lower than the U.S. average excluding California since at least 2010. In recent years, both California’s and the U.S. average clinker carbon intensity have decreased over time, but the gap between the two is closing.
Figure 5: California Cement Plant Clinker Carbon Intensity versus U.S. Average
Historical emissions and fuel use
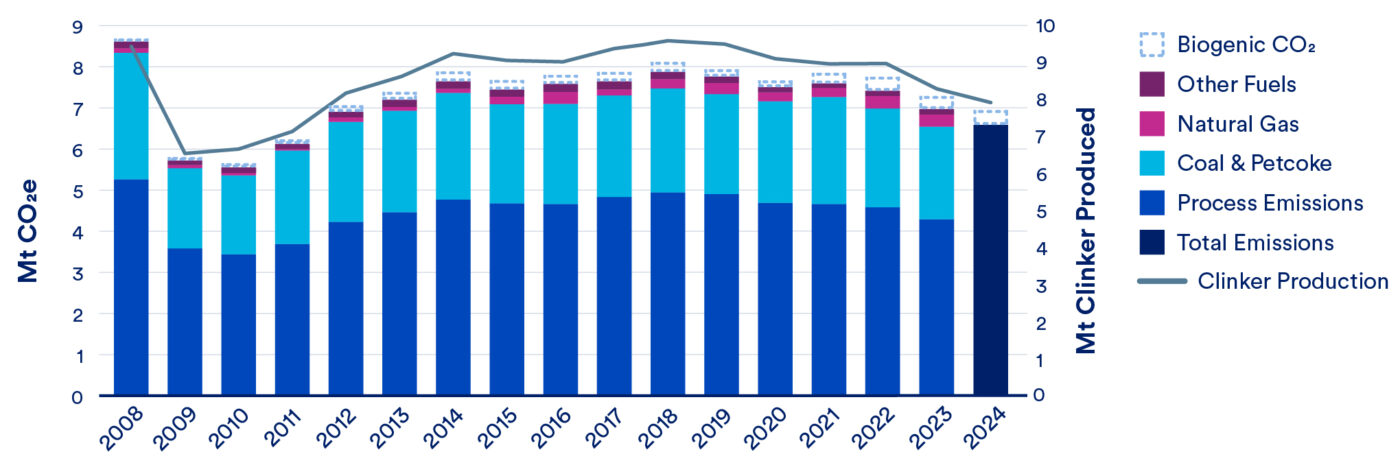
Figure 6 shows the historical GHG emissions of California cement production through 2024, broken down by process emissions and combustion emissions broken down by fuel category.24 CO2 emissions from the combustion of biogenic materials are not included in California’s GHG inventory totals but are included here for completeness.25 The decrease in production from 2008 to 2009 and subsequent increase was due to the Great Recession and economic recovery. Plant closures, including Lehigh’s Permanente Plant in Cupertino, which directly emitted an average of approximately 0.9 Mt CO2e between 2011 and 2019, occurred in 2020. For 2024, emissions data by process and fuel are not yet available through CARB’s Mandatory GHG Reporting program, but total non-biogenic and biogenic emissions are available. Clinker production values through 2023 are from CARB’s Mandatory GHG Reporting Program26 and 2024 clinker production values are from the USGS Monthly Mineral Industry Surveys for Cement for December, 2024.27
Figure 6: Direct GHG Emissions from California Cement Plants by Process and Fuel28
The further breakdown of energy consumption by fuel (TBtu = Trillion British Thermal Units) in Figure 7 illustrates how coal and petcoke continue to provide most of the thermal needs from combustion and contribute the majority of combustion-related GHG emissions. However, natural gas use has increased since 2010 and nearly eclipsed petcoke’s heat production in 2022. Additionally, the sector has seen a 65% decrease in tire derived fuel (TDF) use from 2014 to 2022, with only two kilns consuming TDF in 2023 and a third consuming a byproduct from tire waste processing.29 Municipal solid waste, which CARB defines as “solid phase household, commercial/retail, and/or institutional waste,” was reported as combusted during 7 years between 2010 and 2022. Engineered municipal solid waste (EMSW),30 which is MSW that has been “processed to remove chlorinated plastic and non-combustible materials,” was also consumed during those same years.31 In addition to tires, both MSW and EMSW are both considered “partially biogenic” by CARB. Despite decreases in recent TDF use, since 2009, overall biogenic CO2 emissions have been increasing at a rate of approximately 14,000 metric tons per year due to an increase in use of EMSW and biomass waste.32
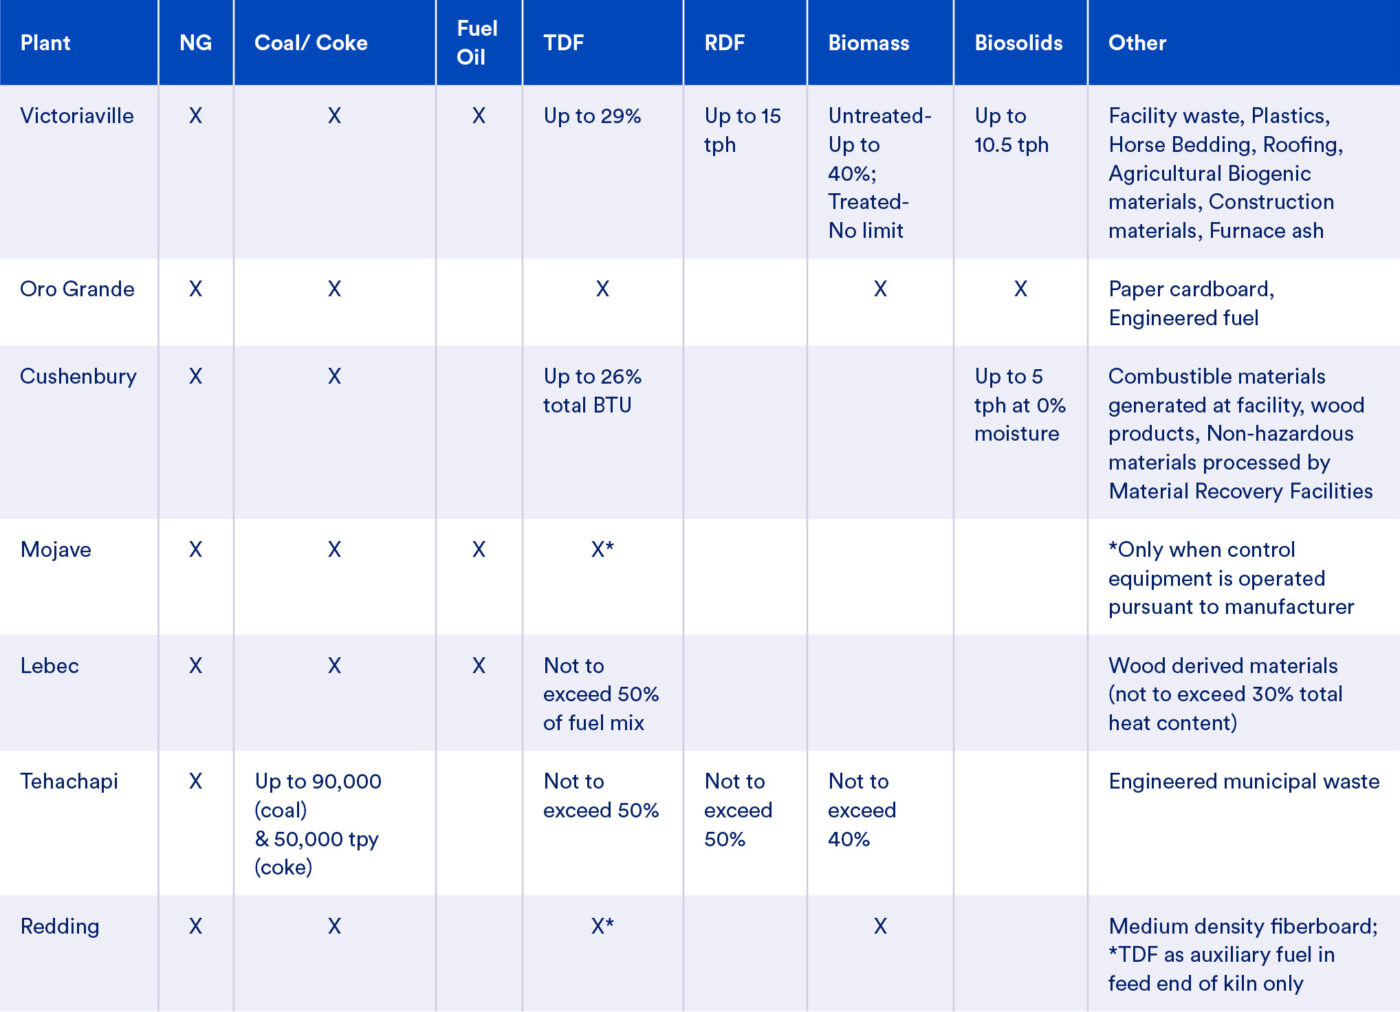
Each facility is permitted to use coal, coke, and natural gas as well as a variety of alternative fuels shown in Table 2. Coal, coke, or natural gas served as the primary fuel across California’s cement plants and contributed to 86% of the combustion thermal demand in 2022.
Figure 7: California Cement Plants Fuel Mix by Heat Content (1012 Btu)33
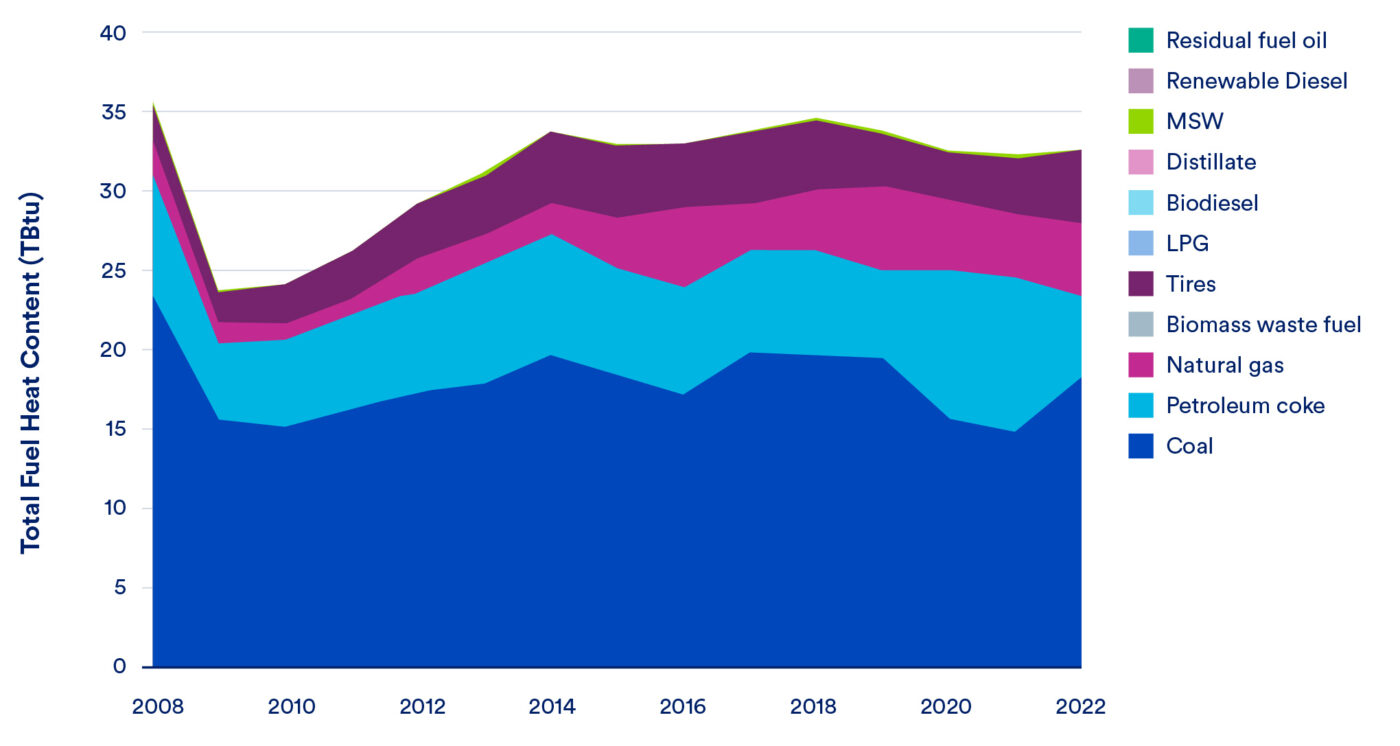
Table 2: Permitted Fuels for California Cement Plants34
Source: NRDC review of California Cement Plant Permits and 2022 Device-Level Emissions Inventory
Overview of non-GHG/toxic emissions from cement operations
Cement plants emit significant amounts of criteria and hazardous air pollutants and are subject to emissions limits in their air permits to control these emissions. California cement plants contribute approximately 2.5% and 2.7% of the state’s NOX and SO2 emissions respectively, while VOC contributions are less than 0.1%.34,35 NRDC conducted a review of the CARB’s 2022 criteria and air toxics data and found that nitrogen oxides (NOX), volatile organic compounds (VOCs), sulfur dioxides (SOx), and toxic air contaminants (TACs)36 emitted by plants are primarily from kiln operations.
NRDC’s review also noted that sites employ a variety of control technologies to meet permit requirements, including baghouses, activated carbon injection, ammonia injection, selective non-catalytic reduction, and others control technologies.
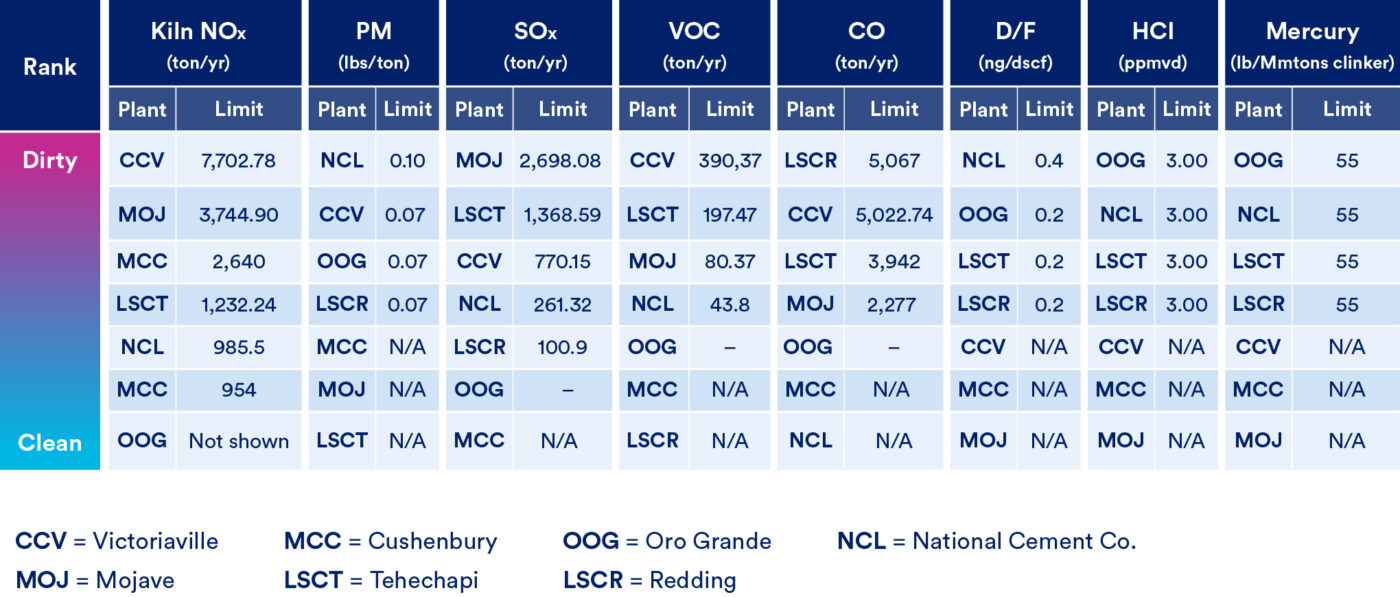
NRDC found that the cement facilities’ overall emissions are often correlated with the permitted emission limits at the kiln (Figure 8), and that addressing local impacts will require a focus on addressing kiln emissions and fuel choice.
Figure 8: Non-GHG Emissions from California Cement Kilns by Permitted Emissions Limits34
Plant geographic distribution and local air quality context
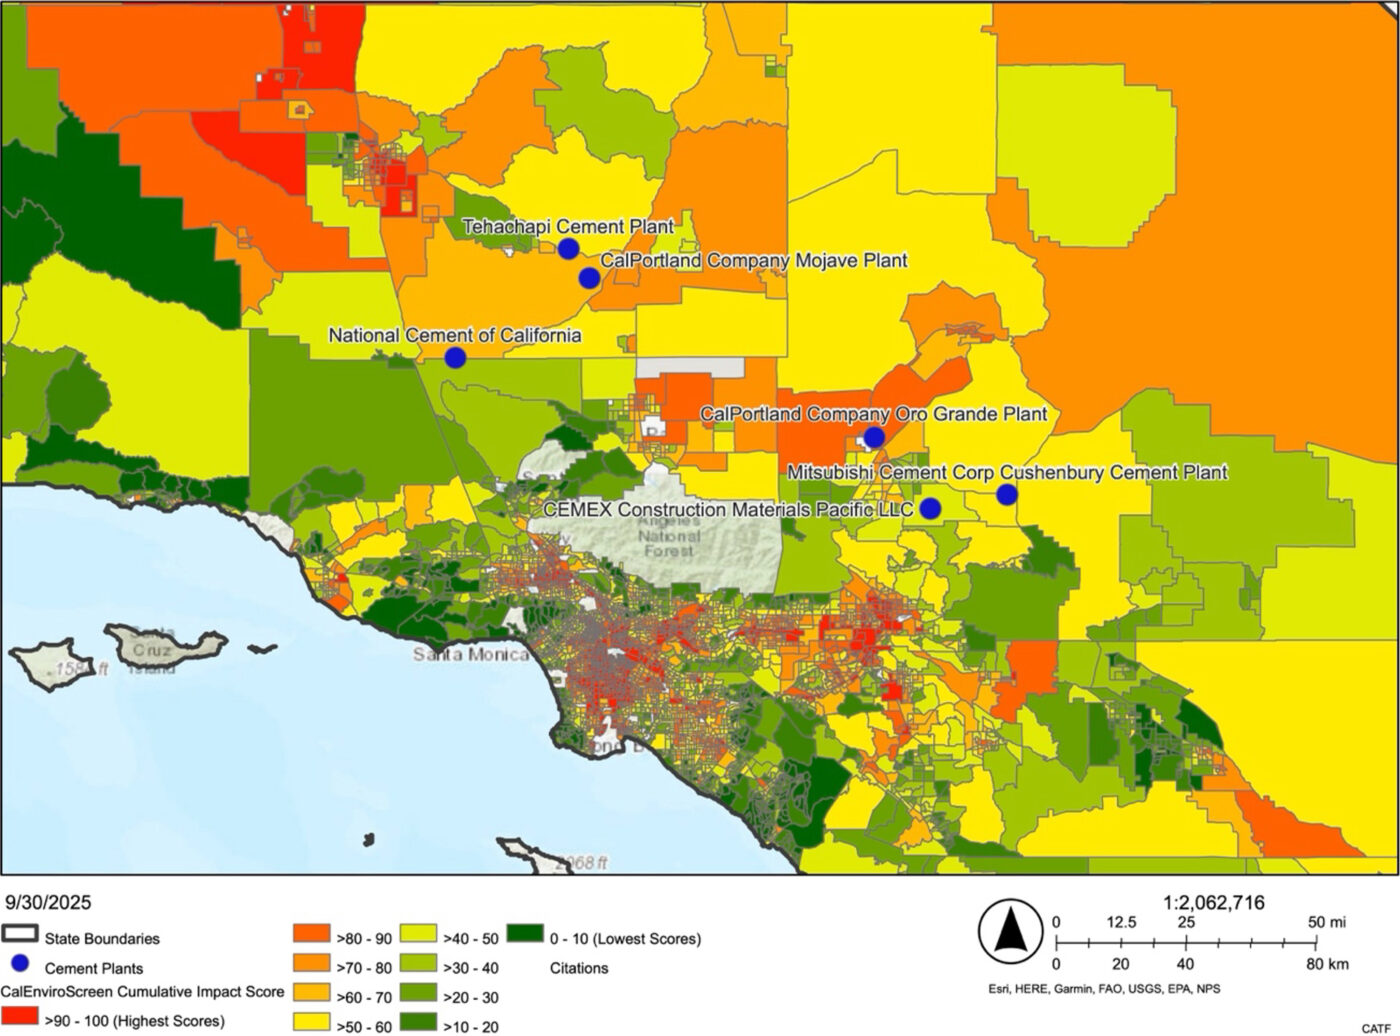
Figure 9 and Figure 10 show the locations of the seven plants and their proximity to CalEnviroScreen disadvantaged communities. California’s cement facilities tend to be located in jurisdictions and communities with relatively low populations,
including unincorporated areas.
The CalPortland Oro Grande plant is the only cement facility that is located within a designated Disadvantaged Community, as defined by CalEPA in 2022. According to CalEnviroScreen, the Census tract in which the Oro Grande plant is located – with a total population of 1,660 – ranks high in ozone exposure, hazardous and solid waste, and poverty and unemployment measures. By contrast, the CalPortland Redding plant in Northern California is located in a Census tract that exhibits a relatively low pollution burden. Importantly, as noted by CARB, cement facilities throughout the state are located in diverse local topography, which can influence how emissions contribute to local and regional air quality.
Figure 9: Northern California Cement Plants, CalEnviroScreen Percentiles at the Census Tract Level
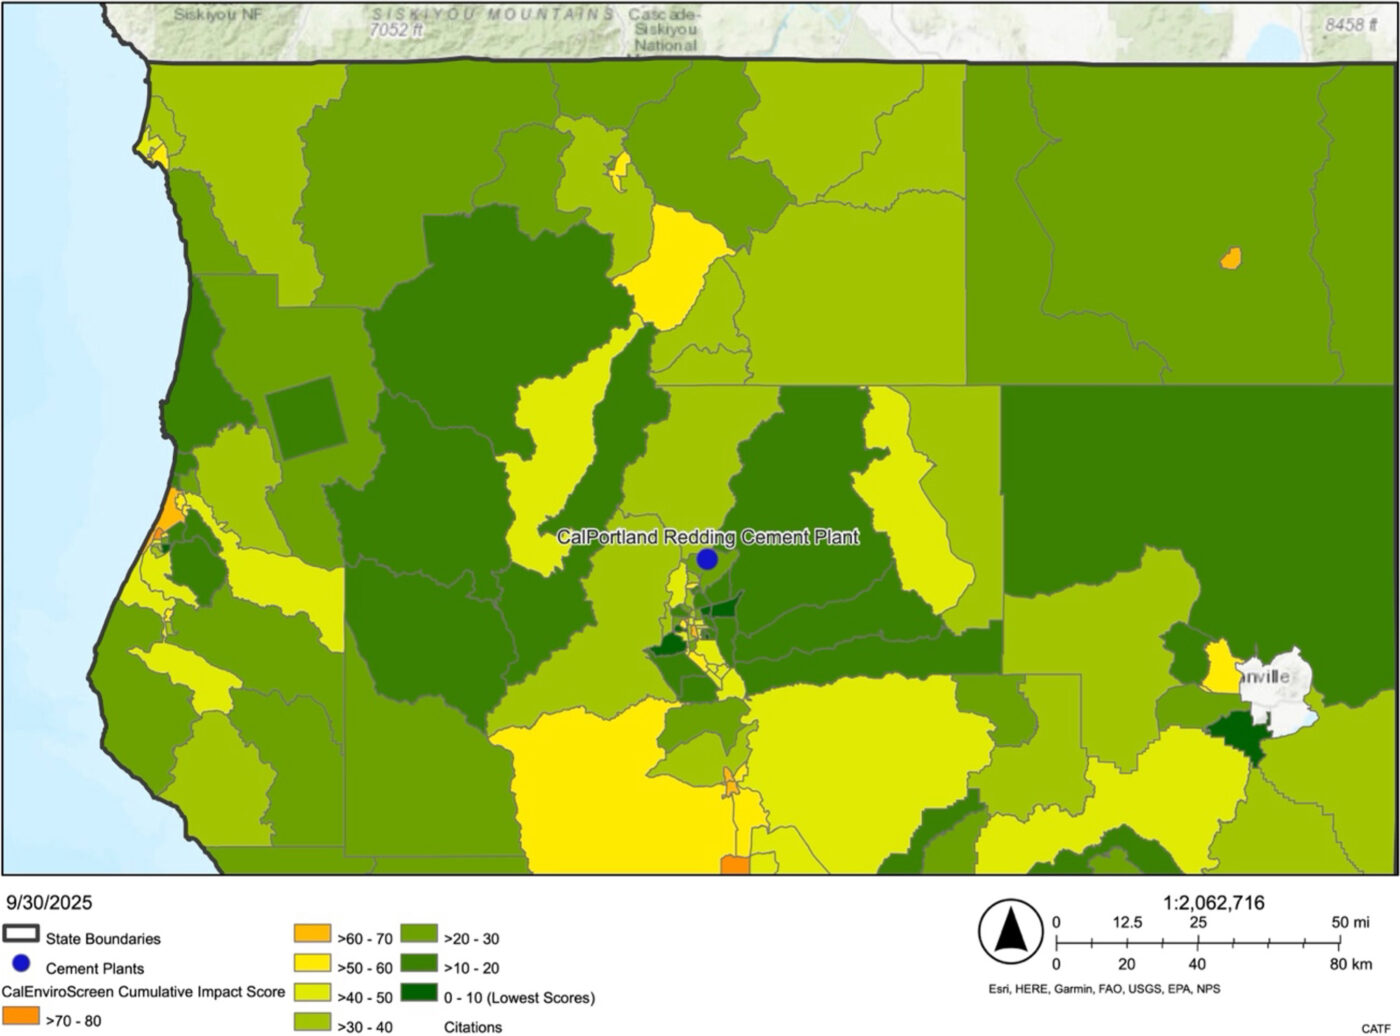
Figure 10: Southern California Cement Plants, CalEnviroScreen Percentiles at the Census Tract Level
Efforts to reduce cement sector emissions in California to date
In 2024, the Department of Energy (DOE) selected two California-based cement companies as part of a portfolio of projects focused on industrial decarbonization, with award negotiations of nearly $700 allocated to Brimstone and National Cement. Funding for both projects was subsequently cancelled as the DOE, under the Trump administration, terminated $3.7 billion in awards from the Office of Clean Energy Demonstrations. California cement companies have also explored alternative methods to reduce their emissions. In 2022, Fortera, a company developing low-carbon cement through its CO2 mineralization technology, began operations at its facility in Redding, California, where it processes a slip stream of the kiln flue gas from CalPortland’s Redding Cement Plant to produce reactive calcium carbonate.37 Reactive calcium carbonate is a supplementary cementitious material that can be blended into cement or mixed into concrete to enhance mechanical properties and reduce clinker requirements.38
Overview of Technologies Included in Report
This analysis focuses on four decarbonization technologies for California’s cement industry: CCS, alternative fuels, blended cement, and electrification.
CCS, or carbon capture and storage, refers to the process of capturing carbon dioxide from point sources or the ambient air (referred to as direct air capture or DAC), and encompasses a wide set of technologies. CCS technology works by installing equipment at emitting facilities (point sources) to separate CO2 from other gases. CCS systems generally consume energy and generate emissions from fossil fuel combustion and electricity use; these emissions must also be captured or otherwise abated for the technology to be effective climate solution. The captured CO2 is then transported to storage sites such as depleted oil and gas fields or saline aquifers. Carbon capture and storage is widely regarded as critical to achieving deep emission reductions in the cement industry because process emissions from calcination constitute such a significant share of overall emissions.39 Over 85% of the life cycle greenhouse gas emissions associated with cement production come from two primary processes: (1) carbon dioxide as a product of the calcination reaction, which fuses raw materials into Portland cement clinker and (2) carbon dioxide from the combustion of fuels.40 These processes which occur in the precalciner and kiln, generally emit CO2 in a single flue gas stream where CCS can be applied. This report examines the application of amine‑based post‑combustion capture for dilute CO₂ streams and compression and purification for pure CO₂ streams, as discussed further in the Summary of the Modeling Framework.
Alternative fuels, or fuel-switching, refer to the use of fuel inputs such as biomass, waste fuels, other biogenic sources, and low-carbon hydrogen to replace incumbent (generally fossil) fuels. Fuel-switching can also involve shifting fuel sources to fossil-based resources that are less carbon intensive, such as switching from coal to natural gas. Alternative fuels can play a meaningful role in decarbonizing many hard-to-abate industries, with particular relevance for cement given its continued reliance on carbon‑intensive fuels; however, the magnitude of emissions reductions varies based on fuel characteristics and lifecycle greenhouse gas accounting. This report examines woody biomass and EMSW as potential alternative fuels and discusses them further in the Summary of Modeling Framework.
Blended cements, clinker substitution, or the use of supplementary cementitious materials (SCMs) are a key strategy for reducing the carbon intensity of cement or concrete while maintaining or even improving performance. SCMs are generally classified into two major categories, hydraulic materials, which harden through reactions with water, and pozzolanic materials, which react with calcium hydroxide, typically supplied by Portland cement, to harden.
There are many potential clinker substitutes,41 including widely used SCMs such as fly ash (pozzolanic), a byproduct of coal combustion, and blast furnace slag (hydraulic), a byproduct of iron- and steelmaking, each with distinct material properties and emissions reduction potentials. SCMs can be introduced at different points in the value chain from grinding with clinker to blending at the concrete batch plant. The extent of substitution is often constrained by resulting physical properties or codes and standards that set limits on replacement ratios for specific applications.42
Certain blended cement formulations such as Portland Limestone Cement (PLC, also known as Type IL) use clinker substitutes to lower their carbon footprint relative to Portland Cement by lowering their clinker content per unit of cement. PLC uses uncalcined limestone (relatively inert compared to clinker or SCMs, but still contributes to material properties) as a cement ingredient, up to 15% by mass, which can reduce the carbon intensity of the resulting cement by roughly 8.2% relative to Portland cement.43 All cement plants in California are capable of producing PLC44 and, according to the U.S. Geological Survey, PLC accounted for a majority of U.S. cement shipments in the first half of 2024, indicating widespread adoption.45 This report evaluates the production of a different limestone-based blended cement formulation known as limestone calcined clay cement (LC3), which makes use of calcined low-grade kaolinite clay to replace clinker. Kaolinite clay is calcined at lower temperatures than calcining in clinker production and forms metakaolin which has pozzolanic properties.46 The use of LC3 is discussed further in the Summary of Modeling Framework.
Beyond limestone-based cements, there are other promising alternative chemistry cements such as magnesium oxides derived from magnesium silicates (MOMS) that are being explored. The U.S. DOE estimates that while alternative cement chemistries could have significant process emission abatement potential (up to 100% theoretically in the case of MOMS), many alternatives are far from technological maturity and require further R&D before market adoption.47
Electrification of the cement production process refers to replacing fossil-derived heat (provided primarily by coal, coke, and natural gas) used for high-temperature process steps (mainly in the kiln and preheater/precalciner) with heat generated by electricity, ideally from low- and zero-carbon electricity. Electrification only addresses GHG emissions from combustion, which accounts for approximately 40% of California’s scope 1 cement emissions. The remaining 60% are process emissions inherent to the calcination of limestone which will need to be abated with another technology. This study considers electrification of the kiln and precalciner/preheater by using resistive electric heating to deliver energy needs to the precalciner, and a plasma generator, which provides high-temperature heat to the kiln using air as plasma gas. While other electrified cement production technologies like Sublime Systems’ electrochemical process exist, these technologies are implemented in greenfield deployment and therefore not the focus of this study.
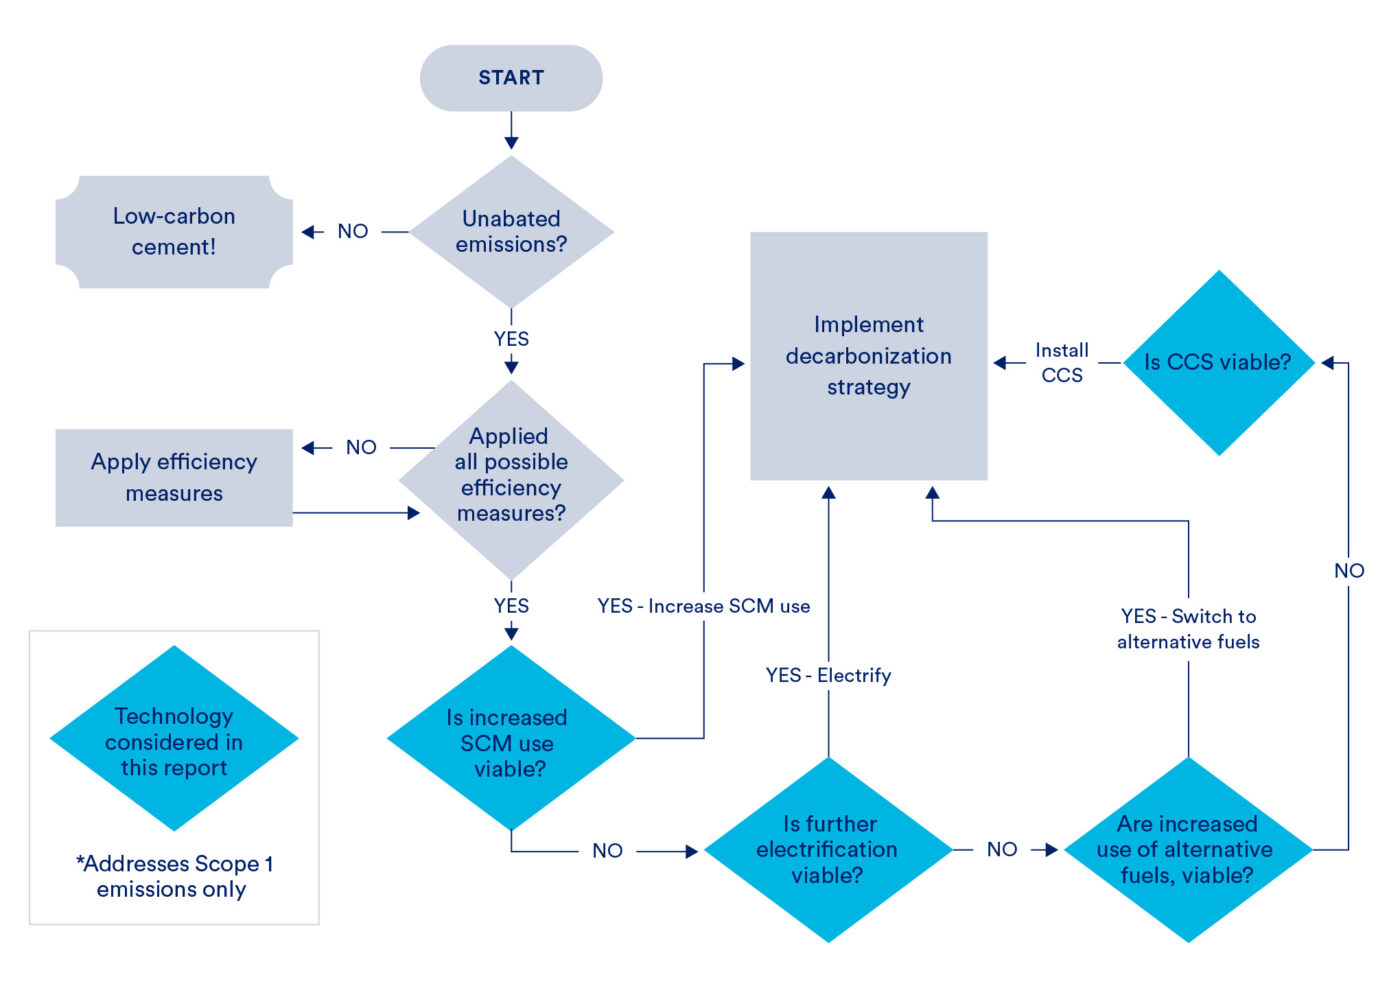
Cement facilities must employ a combination of decarbonization strategies to abate all on-site emissions. Technology readiness levels (TRLs) of these four technologies are discussed in the Technical feasibility section. Due to the process CO2 emissions inherent to clinker production and the limits of other decarbonization strategies (e.g., SCMs have physical property limits, fuel switching is limited by clinker physical properties and availability of low- and zero-carbon fuels, and electrification only targets fuel combustion-related emissions), CCS must be considered to abate residual direct CO2 emissions. Figure 11 is an illustrative example of how a facility might approach decarbonization pathway decisions considering the technologies considered in this report. However, as the U.S. DOE notes, “the decisions suitable for a given facility or industrial entity will largely be dependent on constraints and limitations unique to them.”48
Figure 11: Illustrative cement plant decarbonization flowchart.
Adapted from U.S. DOE, 2025, Transformative Pathways for U.S. Industry: Unlocking American Innovation
Summary of Modeling Framework
Synapse modeled a baseline scenario and four decarbonization pathways, all of which represent a retrofit of a cement plant when the existing cement kiln reaches its end-of-life. Cement kilns are long-lived assets49—the average age of operational cement kilns in California is 35 years – so when they reach end-of-life, plant owners face a natural decision point about what technology to use for replacement.50 The retrofitted plant in this analysis begins operation in year one, 2028, with the new capital equipment. The scenarios are as follows:
- Baseline: The baseline scenario assumes the cement plant continues to use conventional technology while installing a new conventional rotary kiln.51 It also continues to use a mixture of fossil fuels (coal, petroleum coke or “petcoke,” and gas) and alternative fuels (tires and biomass) for pyroprocessing. The fuel mix of the representative facility matches the current fuel mix for the California cement industry.52 To provide a fair comparison to the cost of decarbonization pathways that involve replacement of the rotary kiln (primarily Pathway 2), the baseline includes the cost of fully replacing the rotary kiln. Startup of the plant is assumed to be 2028 for the purposes of this study. The Baseline scenario used in the modeling is not the same baseline established in the Draft SB 596 Cement Strategy.53 The Draft SB 596 recommended baseline is intended to help establish interim GHG emission targets and includes the carbon intensity of imported cement, whereas the Baseline in this report allows for comparison of decarbonization pathways and is based on an average cement plant in California using publicly available information.
- Pathway 1 (CCS only): In Pathway 1, the representative facility installs the same conventional kiln as in the baseline scenario and continues to rely on the baseline fuel mix. It also installs an amine-based, post-combustion carbon capture and storage (CCS) system that removes 90%54 of the carbon dioxide in the plant’s exhaust stream for long-term storage. Pre-treatment of the flue gas is required to reduce concentrations of SO2 and PM entering the carbon capture unit and the facility installs an SO2 scrubber and a wet electrostatic precipitator. The CCS system burns natural gas in a boiler to produce steam, which it uses to heat the CO₂-rich amine solvent in a stripping column, releasing the captured CO₂ and regenerating the solvent for reuse. The CCS system also captures 90% of CO2 emissions from the natural gas boiler.
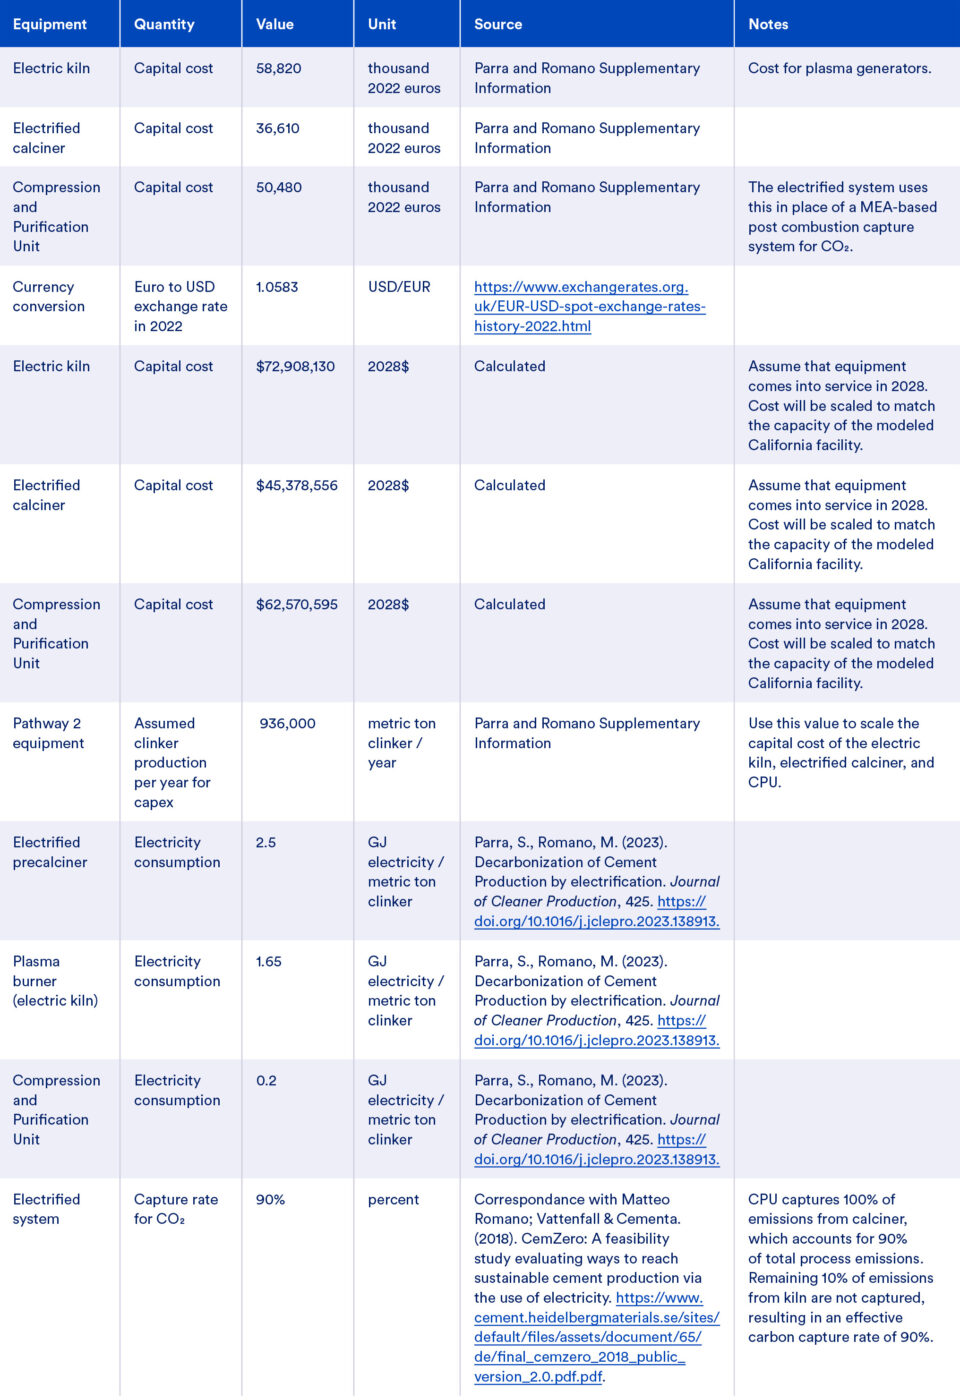
- Pathway 2 (Electrification + CCS): In Pathway 2, the representative facility electrifies fully, installing both an electric precalciner using resistive heating and an electric kiln using plasma generators. Electricity is sourced from the grid. In the electrified system, the only on-site emissions are process emissions, 90% of which are emitted from the precalciner in an exhaust stream that is essentially pure CO2 (99% CO2 by volume). The remaining 10% of emissions are emitted from the kiln in a dilute stream. In this pathway, the representative facility installs a compression and purification unit to compress and purify the precalciner emissions, so the effective capture rate for Pathway 2 is 90%, which is the same as for Pathways 1, 3, and 4. Unlike in Pathways 1, 3 and 4, the representative facility in Pathway 2 does not include an amine-based CCS system.55
- Pathway 3 (Blended Cement + CCS): In Pathway 3, the representative facility begins producing limestone calcined clay cement (LC3), which has a lower concentration of clinker than OPC (explained in more detail below). The modeling assumes the facility will produce both clinker and calcined clay for the LC3 on-site in separate rotary kilns. The facility also installs the same type of amine-based CCS system as in Pathway 1, including pre-treatment.
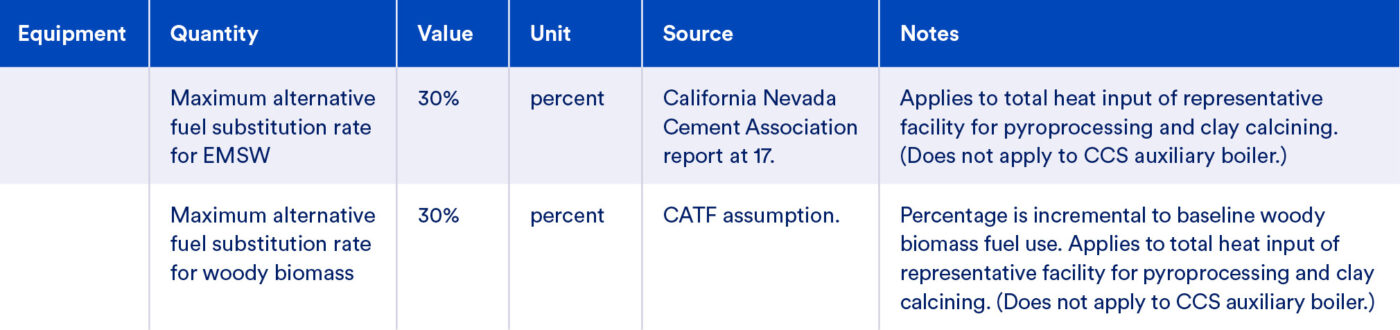
- Pathways 4a and 4b (Blended Cement + Alternative Fuels + CCS): In Pathway 4, the representative facility produces LC3 in an identical way to Pathway 3 while also increasing its use of alternative fuels by substituting woody biomass56 (Pathway 4a) or EMSW57 (Pathway 4b) for 30% of the heat input delivered by petcoke and coal in the baseline. The facility also installs the same type of amine-based CCS system as in Pathway 1, including pre-treatment. Woody biomass and EMSW were chosen as illustrative examples of solid fuels that could replace petcoke and coal in cement production; however, other alternative fuel options may be more suitable. There is considerable uncertainty around emissions factors and non-GHG emissions associated with combustion of EMSW. EMSW may have chlorinated plastic content and may require further processing. These uncertainties around EMSW and other potential alternative fuels must be addressed with additional analyses to determine suitability of individual alternative fuels.
For each scenario, Synapse modeled annual feedstock consumption, energy use by fuel and process, and cement production. These results were used to calculate fuel and material costs, revenue, and CCS costs for the representative facility over the lifetime of the equipment (2028–2050). Synapse also estimated capital expenditures for each pathway. Non-energy and non-material operations and maintenance costs were assumed to be roughly constant across pathways and were not included as a separate cost category. For the CCS equipment, Synapse modeled the energy needed to capture carbon dioxide from the facility’s exhaust stream but did not model energy consumption for CO2 transport or long-term storage. Estimates of CO2 transportation and storage costs are included as part of each pathway’s abatement cost.
Finally, Synapse calculated energy- and process-related emissions over the lifetime of the equipment in each pathway. For energy-related emissions, Synapse evaluated direct emissions from combustion of fuels and process emissions (Scope 1) and indirect emissions from use of electricity generated off-site (Scope 2). Off-site (Scope 3) emissions, such as those associated with quarrying raw material, fuel production and delivery, and utilization of cement by end users, were outside the scope of this analysis. Synapse also excluded the full lifecycle impacts of fuels used at the representative facility in techno-economic and lifecycle assessment results. For example, the analysis did not account for upstream greenhouse gas emissions such as methane leakage from natural gas infrastructure, nor did it include downstream carbon removals or biogenic carbon cycle effects associated with biomass-based fuels. In other words, all CO2 emissions resulting from the combustion of any fuel were treated the same on a global warming potential basis, regardless of their origin. The appendix gives detailed information on input assumptions.
Pathway Modeling Results
Carbon dioxide emissions
All four pathways offer substantial CO2 emissions reductions relative to the baseline scenario starting in 2028, the year the equipment begins operating. Pathway 1 reduces year 1 cement emissions intensity by 84%, Pathway 2 by 72%, and Pathways 3 and 4 by 89%. These reductions increase over time as the electricity supply in California decarbonizes58 — especially in Pathway 2, where an additional 20% reduction brings the pathway to a final 92% reduction relative to the baseline by 2050. Pathways 1, 3, and 4 each decrease an additional 4% relative to the baseline by 2050. All pathways assume an effective carbon capture rate of 90% for Scope 1 (on-site) combustion and process emissions.
Table 3 shows pre-capture CO2 and post-capture CO2 emissions in each scenario in 2028 and 2050. Pre-capture CO2 is broken out by Scope 1 (direct, on-site) and Scope 2 (indirect, purchased electricity). Scope 1 is further divided into energy-related CO2 and process CO2. The baseline results for 2050 show a representative facility whose electricity supply decarbonizes, but the facility does not implement other decarbonization strategies. This results in an overall emissions decrease of 2%. The pre-capture CO2 intensity of cement in Pathway 1 is 21% higher than the baseline, primarily due to increased Scope 1 fuel combustion emissions for the CCS auxiliary boiler. The pre-capture CO2 intensity of cement is 17% lower than the baseline in Pathway 2, 27% lower in Pathway 3, 26% lower in Pathway 4a, and 27% lower in Pathway 4b. The difference between 4a and 4b is due to different CO2 emissions factors for the alternative fuels. Pathways producing LC3 offer the largest reductions in pre-capture CO2 in 2028 because LC3 adoption substitutes calcined clay for a portion of the clinker, reducing both fuel combustion emissions and process emissions. The LC3 pathways are the only scenarios that reduce pre-capture process emissions in addition to energy-related emissions. Pathway 2 also offers substantial reductions in energy-related emissions because it eliminates on-site combustion. These reductions grow over time as the electricity supply in California decarbonizes. Relative to the baseline in 2028, Scope 2 emissions in Pathway 2 increase 812% due to the electrified process and account for 79% of post-capture emissions. However, as the grid decarbonizes Pathway 2 Scope 2 emissions will decrease 8% from the baseline in 2028 to 2050. Scope 2 emissions account for 27% of post-capture emissions in Pathway 1 and an average of 34% of post-capture emissions in Pathways 3 and 4. This represents a Scope 2 emissions increase of 81% relative to the baseline in Pathway 1 and an increase of 50% in Pathways 3 and 4 due to the electricity needs of the CCS equipment.
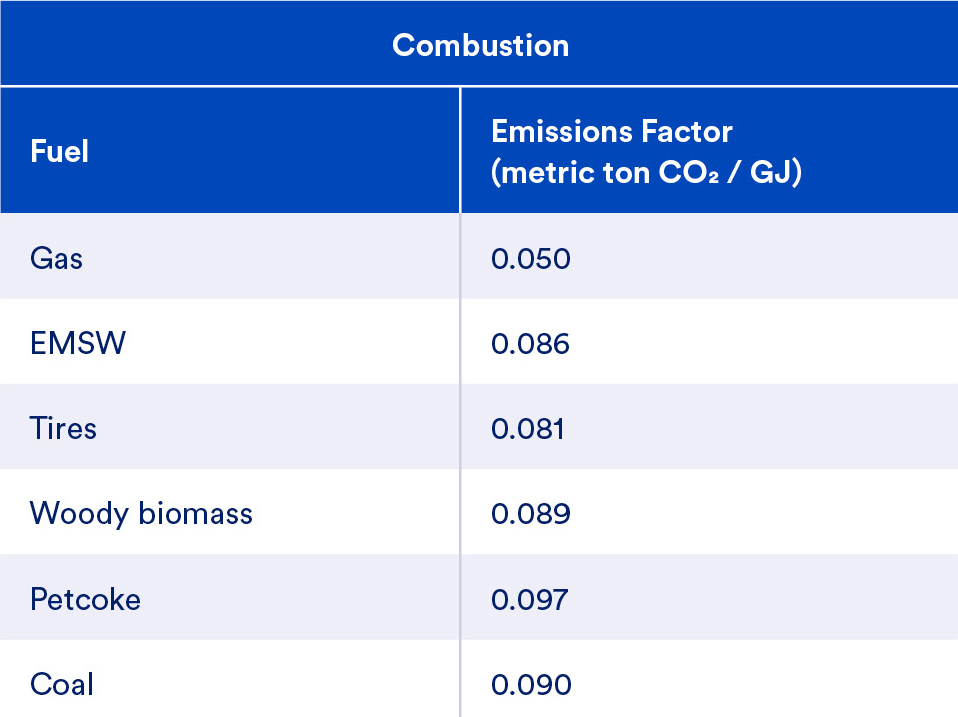
The substitution of alternative fuels for petcoke and coal in Pathway 4 offers only a slight direct emissions benefit, since the CO2 emissions factor of woody biomass is 0.089 t CO2 per gigajoule (GJ) and that of EMSW is 0.086 t CO2 per GJ, which is only 1% and 4% lower than coal (0.090 t CO2 per GJ) and 7% and 11% lower than petcoke (0.097 t CO2 per GJ) respectively. Some alternative fuels may deliver additional lifecycle emissions benefits, which were beyond the scope of this analysis. For example, even though forest-derived biomass may have a similar CO2 emissions factor to a fossil fuel, using the biomass may provide broader improvements to air quality or emissions reductions if
the biomass was harvested to reduce wildfire severity.59
Table 3: Emissions intensity by pathway for 2028 and 2050
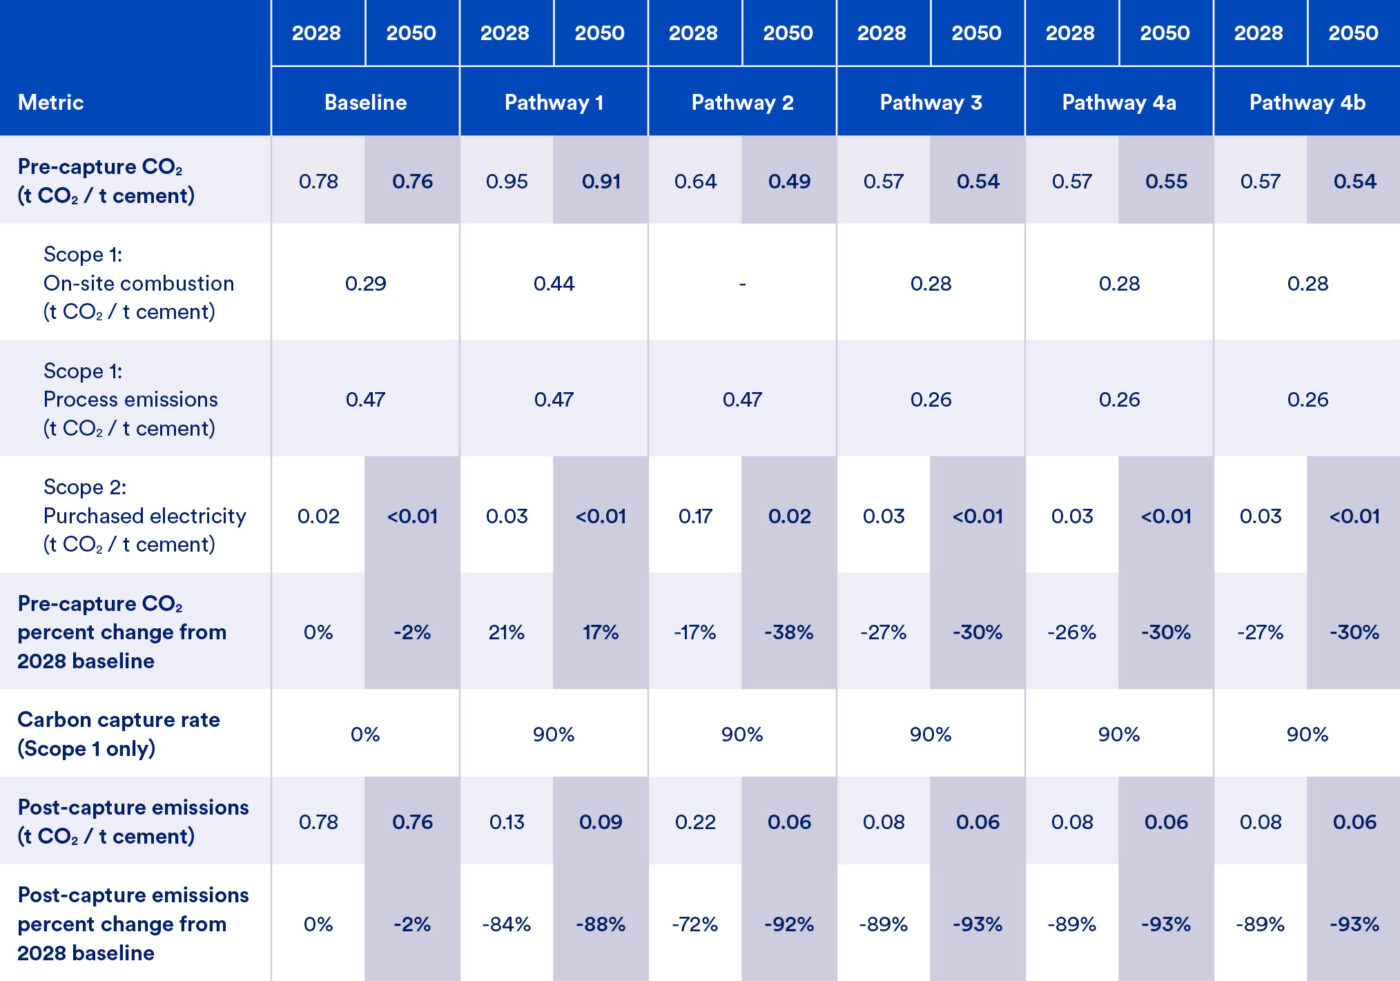
Notes: Only Scope 1 emissions are available for capture by the CCS system. Scope 2 emissions occur off-site and so cannot be captured by CCS equipment located at the cement plant.
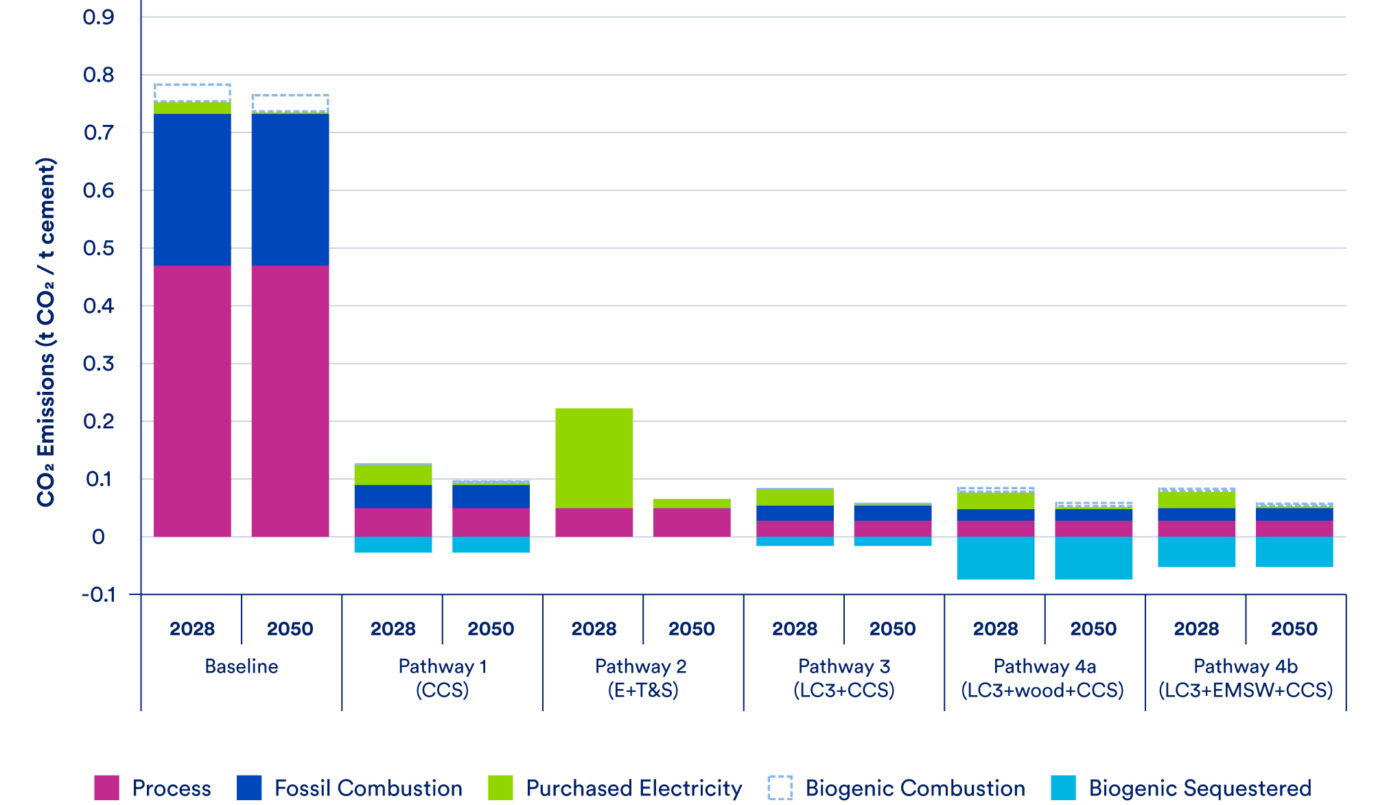
Figure 12 shows post-capture CO2 emissions for each pathway in 2028 and 2050 further categorized by type of emission: process emissions, purchased electricity, on-site combustion divided into fossil and biogenic contributions, and sequestered biogenic CO2.60 Fossil CO2 emissions include combustion emissions from coal, petcoke, natural gas, and anthropogenic contributions from combustion of fuels that have biogenic content. Biogenic CO2 emissions account for 4% of post-capture emissions for the baseline pathway, decrease to 2% of Pathway 1 emissions, increase to 10% of Pathway 4a emissions, and increase to 7% of Pathway 4b emissions. The increases are due to the biogenic content of the alternative fuels. Biogenic contributions are calculated based on the assumed biogenic content of each fuel shown in Table 4. Notably, as the grid decarbonizes in 2050, biogenic CO2 accounts for 14% of post-capture emissions in Pathway 4a.
Table 4: Assumed biogenic content of select fuels

Beyond the potential slight direct CO2 emissions benefit that the substitution of woody biomass or EMSW for petcoke and coal provides, switching to fuels of biogenic origin—such as woody biomass, EMSW, or tires—shifts fossil CO2 emissions to biogenic CO2 emissions, which can provide further opportunities for GHG reductions. According to CARB, biogenic CO2 combustion emissions are “part of the existing natural atmospheric carbon cycle and not newly present in the atmosphere, as is the case for fossil fuel-derived carbon.”63 Therefore, in this assessment, CATF calculated permanently sequestered biogenic emissions, such as those in Pathways 1, 3, and 4, as permanent carbon dioxide removals (without considering lifecycle emissions of the systems) and displayed them below the x-axis in Figure 12. In practice, to be considered biomass carbon removal and storage, the entire system must durably/permanently store more carbon than greenhouse gases it emits on a lifecycle basis, and the carbon dioxide removals must be quantifiable, verifiable, permanent, and consistent with the requirements of SB 905.64 Considering Scope 1 and 2 emissions along with the modeled removals to offset these emissions, Pathway 4a achieves net zero after year 1 and net negative emissions by 2050, and Pathway 4b reaches net zero in 2050, highlighting the opportunity for bioenergy carbon capture and storage (BECCS) to contribute to cement decarbonization.
Figure 12: CO2 emissions breakdown by process, purchased electricity, fossil, and biogenic in each pathway
Carbon abatement cost
Carbon abatement costs, modeled over the lifetime of the facility (2028-2050), are the lowest in Pathway 4b, which has a total lifetime cost of $98 per t CO2 (2024$). Pathways 3 and 4a have a similar total lifetime cost of $99 and $100 per t CO2 (2024$) respectively. Pathway 1 has a higher abatement cost of $182 per t CO2 (2024$). Abatement costs in Pathway 2 are over four times higher than Pathways 3 and 4 at $479 per t CO2 (2024$).
Table 5 shows how changes in capital expenditures, energy costs, material costs, and carbon storage costs relative to the baseline contribute to the total abatement cost in each pathway. Increases in lifetime energy costs and carbon storage costs relative to the baseline are the largest contributors to the abatement cost in all pathways. For example, the electricity used in Pathway 2 increases energy costs by $264 per metric ton of cement compared to fuel costs in the baseline.65 Pathways 3 and 4 show slight material cost savings relative to the baseline. They also have lower energy costs than Pathway 1 because they consume less energy overall and because woody biomass and EMSW cost less than the petcoke and coal they replace (The use of EMSW at cement plants does face some regulatory barriers to adoption, discussed below).
Table 5: Summary of carbon abatement cost by pathway
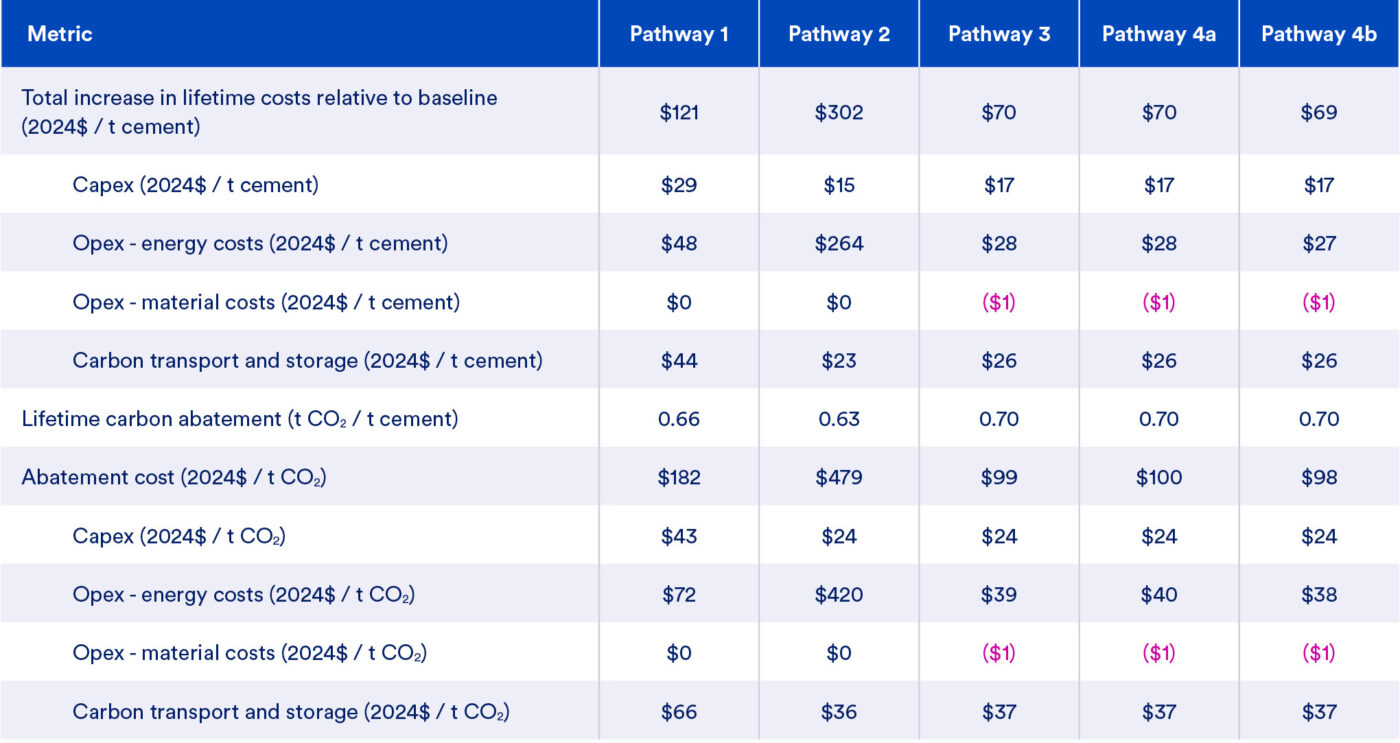
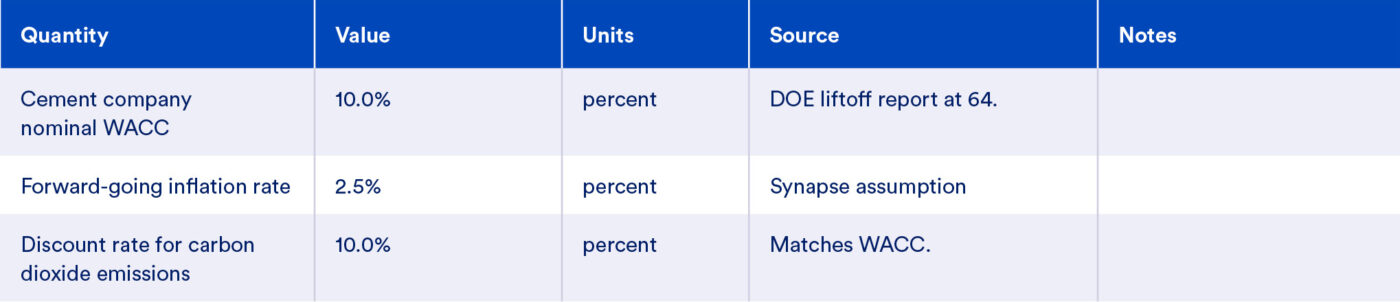
Notes: Cost values shown are the net present value (NPV) of annual costs from 2028–2050 using a 10% discount rate to represent the nominal weighted average cost of capital to a cement producer. Lifetime cement production and lifetime carbon abatement are similarly calculated as NPVs with a 10% discount rate.
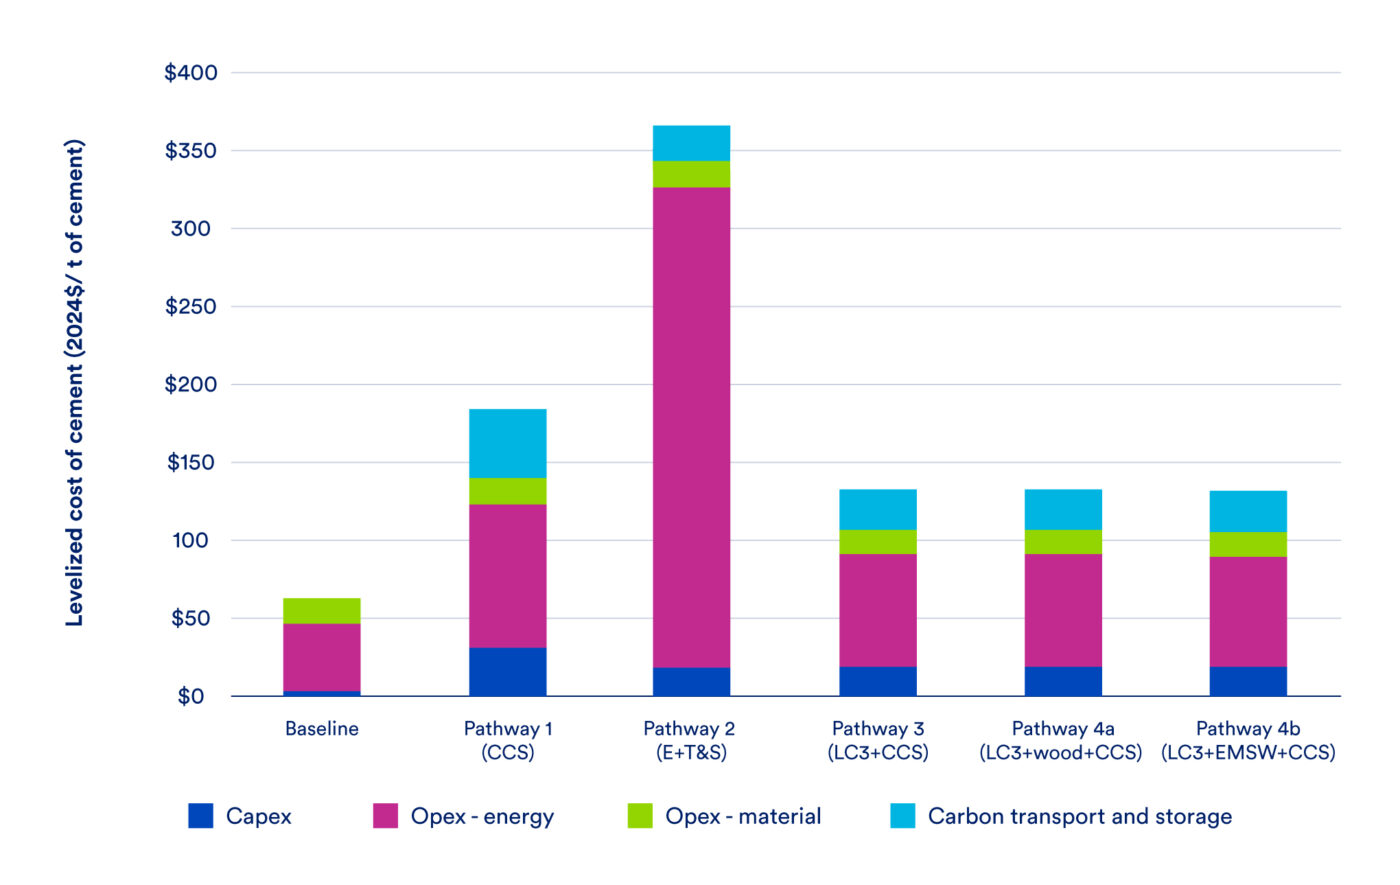
Figure 13 provides an alternate visualization of the relative contributions of capital and operating expenditures to the lifetime costs of each pathway. This figure shows the levelized cost of energy, materials, and equipment for cement. Note that the figure does not show the full levelized cost of cement, because it does not include non-energy operations, labor, and maintenance, as discussed above. Similar to the carbon abatement costs in Table 5, Figure 13 shows that energy costs are a major driver of lifetime cost differences between pathways. Carbon transport and storage costs and capital costs differ between the pathways but are smaller contributors to total lifetime cost, while material costs are very similar in all scenarios. The following sections discuss the factors driving abatement costs in more detail, including cement production levels, feedstock consumption, energy use, and capital expenditures.
Figure 13: Levelized cost of energy, materials, and equipment for cement
Cement production and composition
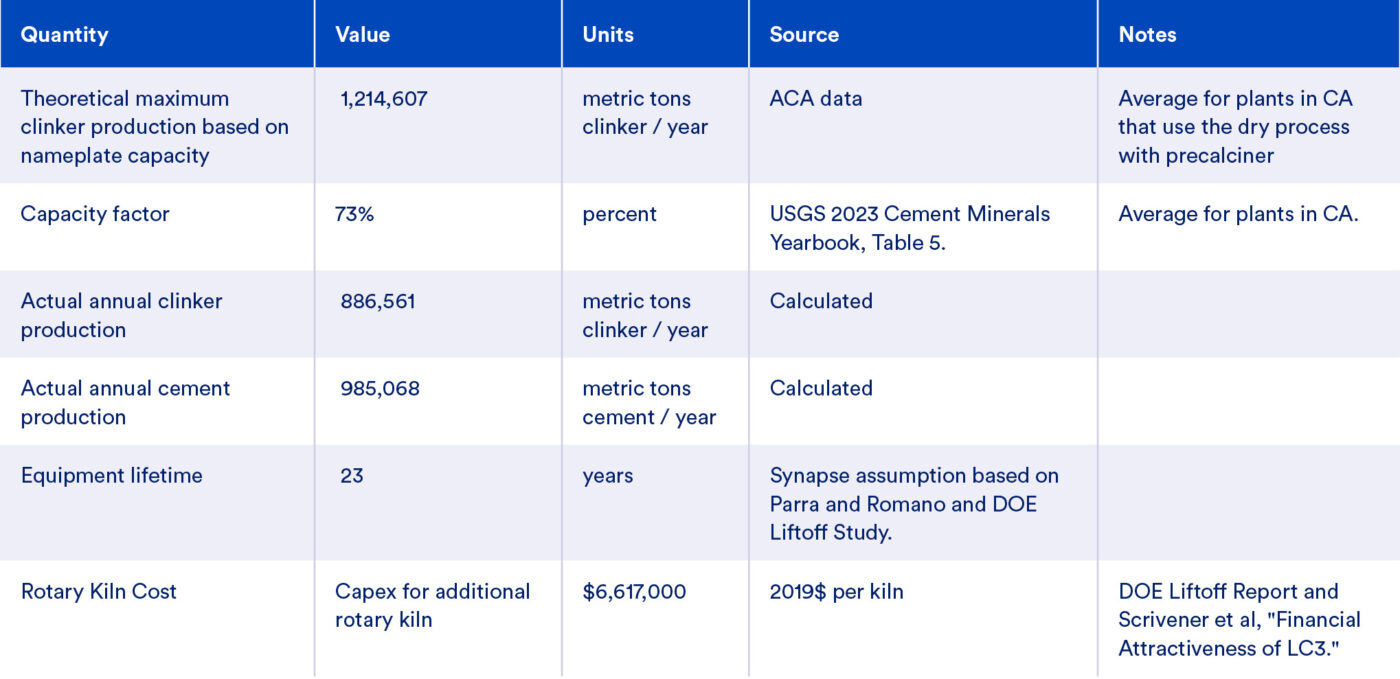
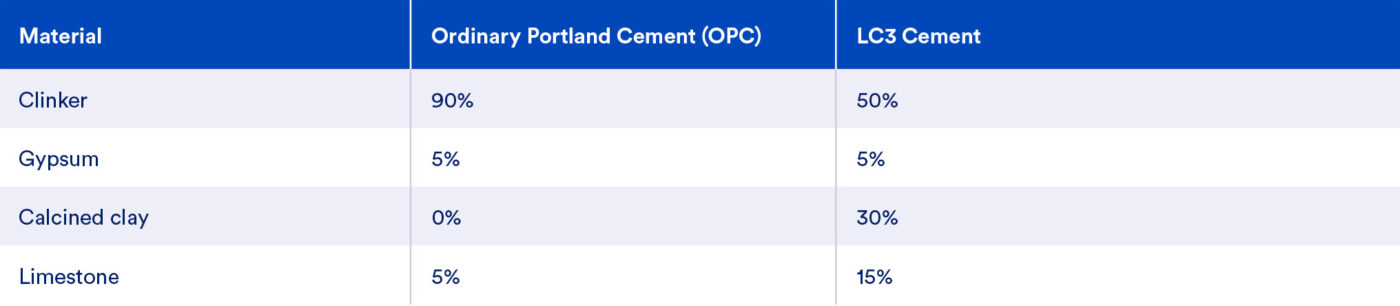
In the baseline and Pathways 1 and 2, the representative facility produces OPC, which is 90% clinker by weight (Table 6). The plant has a capacity of 1.2 million metric tons (Mt) of clinker per year and a capacity factor of 73%, so it produces 0.89 Mt of clinker per year, resulting in an annual output of 0.99 Mt of cement.
In Pathways 3 and 4, the representative facility produces an alternative formulation of cement known as LC3. LC3 partially substitutes calcined clay and limestone, as supplementary cementitious materials, for clinker. This reduces the share of clinker in the finished cement to 50% by weight (Table 6). Absent capacity restrictions on other plant equipment, switching to LC3 production could thus enable a plant to double its cement output while keeping clinker production constant. Pathways 3 and 4 model the representative facility as increasing its cement output by only 33% to stay within the capacity limits of other existing equipment (e.g., finish grinding). In total, the representative facility in Pathways 3 and 4 produces 0.66 Mt of clinker and 0.39 Mt of calcined clay per year, resulting in annual production of 1.3 Mt of cement.
Table 6: Composition of ordinary Portland cement and limestone calcined clay cement (percent by weight)
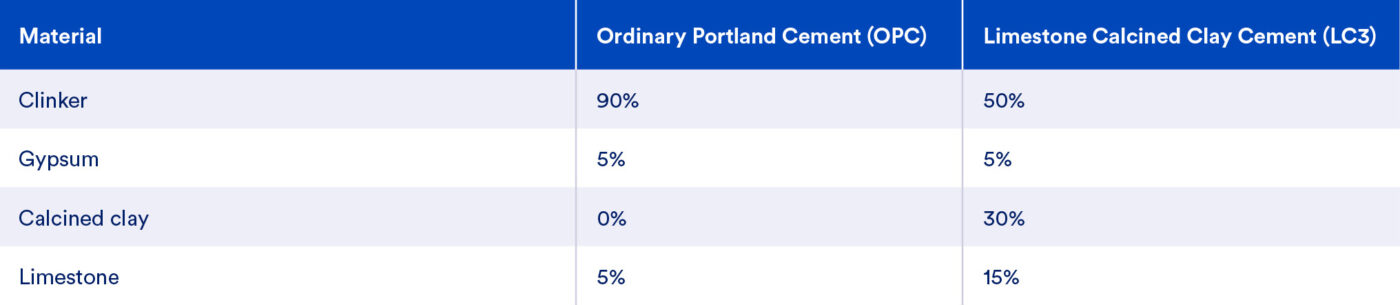
Note: The baseline and Pathways 1 and 2 produce OPC. Pathways 3 and 4 produce LC3.
Feedstock consumption
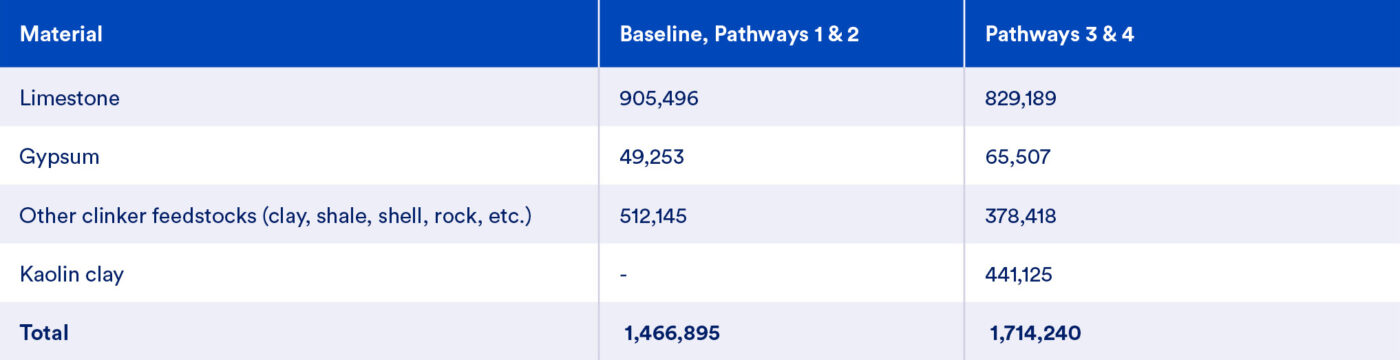
The representative facility produces the same amount of OPC in the baseline and Pathways 1 and 2, so these three scenarios have identical annual feedstock consumption (Table 7). In these pathways, the representative facility uses a mixture of limestone and other feedstocks including clay, shale, shell, and rock to produce clinker. Gypsum and additional limestone are then blended with the clinker to produce finished cement. In total, the representative facility uses 0.91 Mt of limestone, 0.05 Mt of gypsum, and 0.51 Mt of other feedstocks per year.
In Pathways 3 and 4, the representative facility uses slightly less of the clinker feedstocks (0.83 Mt of limestone and 0.38 Mt of other feedstocks per year) due to its reduced annual clinker production. It consumes 0.06 Mt of gypsum, which is a 33% increase, proportional to the change in cement production. In addition, it consumes 0.44 Mt of kaolin clay per year to produce the calcined clay used in LC3 production.
In all pathways, the mass of input feedstocks exceeds the mass of output cement, because some mass is lost during calcination. The high-temperature calcination process that produces clinker results in mass loss of approximately 35%, primarily in the form of CO2, which is why OPC has a high process emissions intensity (discussed in more detail below). Clay calcination results in mass loss of approximately 11%, primarily in the form of water vapor.66
Table 7. Feedstock consumption by pathway (metric tons per year)
Energy use
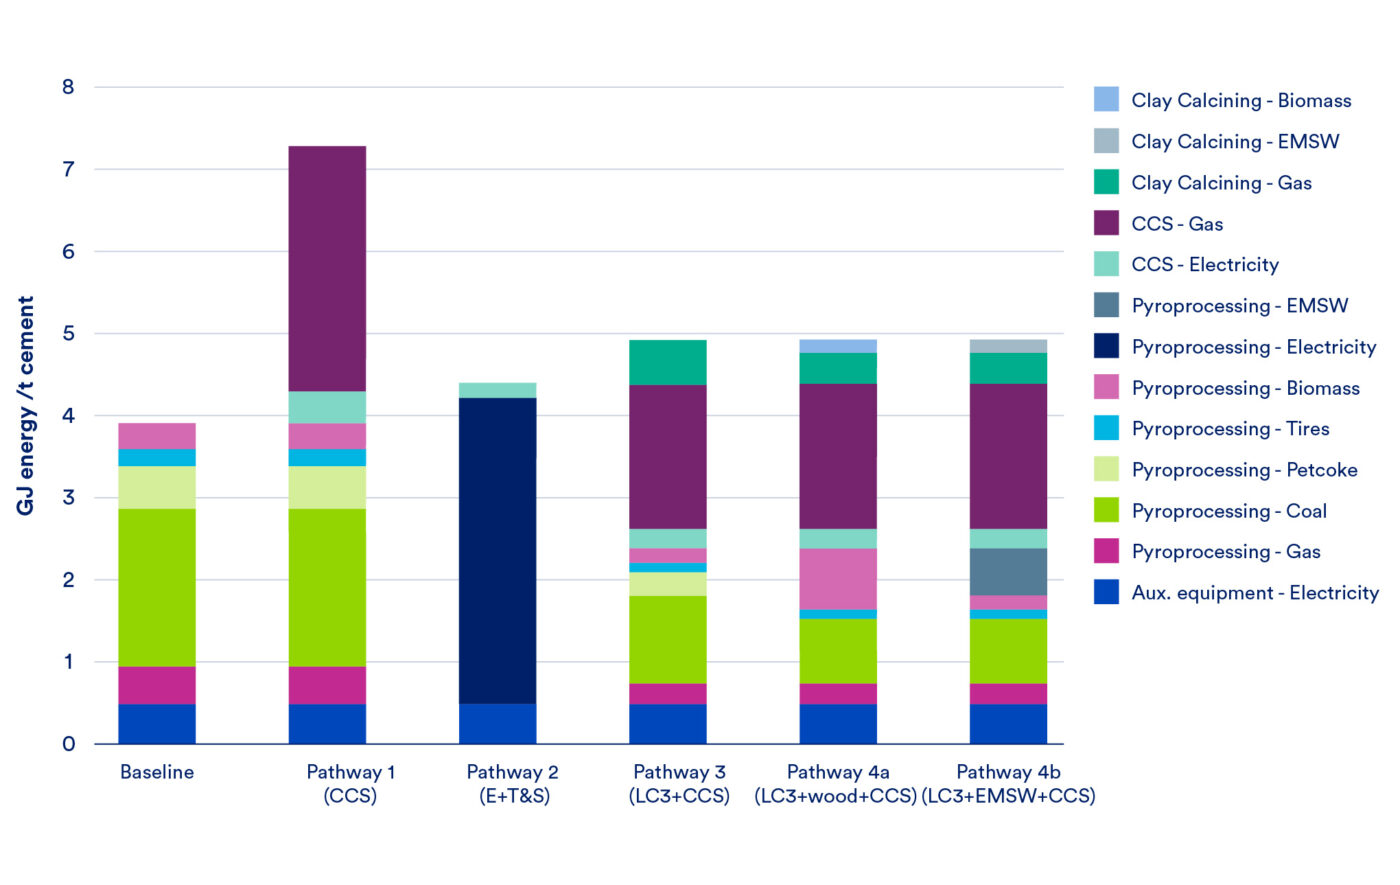
Figure 14 shows energy consumption by scenario, broken out by fuel and process. All pathways consume more energy per metric ton of cement than the baseline, primarily due to the added energy demands associated with operating carbon capture equipment. The increase is most pronounced in Pathway 1, which requires 7.3 GJ to produce one metric ton of cement, which is 87% higher than the baseline value (3.9 GJ per t cement). Pathway 2 uses 4.4 GJ per t cement (13% increase from baseline) and Pathways 3 and 4 use 4.9 GJ per t cement (26% increase).
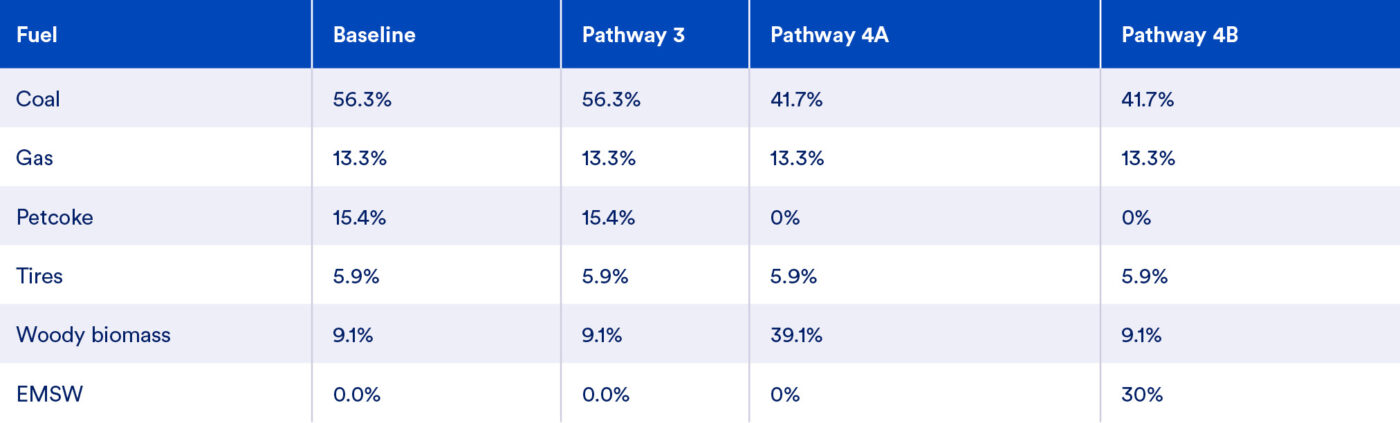
In all scenarios, the representative facility consumes 0.48 GJ of electricity per metric ton of cement to power auxiliary equipment that performs functions such as crushing, grinding, and milling. In the baseline, the remaining 3.4 GJ of energy consumption per metric ton of cement is for pyroprocessing (the combined energy consumption of the precalciner and kiln). The baseline facility uses the same mix of fuels as the sector-wide mix in California, which is 56% coal, 15% petcoke, 13% natural gas, and 15% alternative fuels (tires and biomass).
The 87% increase in energy consumption in Pathway 1 relative to the baseline is a result of the energy penalty from the CCS system, which consumes 0.4 GJ of electricity and 3.0 GJ of fuel (natural gas) per metric ton of cement.67 The CCS system burns natural gas in a boiler to produce steam, which it uses to heat the CO₂-rich amine solvent in a stripping column, releasing the captured CO₂ and regenerating the solvent for reuse. Notably, the boiler’s natural gas consumption in Pathway 1 is nearly equal to the amount of fuel used for pyroprocessing, which is itself an energy-intensive process.
In Pathway 2, the representative facility is completely electrified. The efficiency of the electrified kiln and precalciner is slightly lower than the baseline equipment, increasing the energy needed for pyroprocessing by 9%. However, the total energy consumption in Pathway 2 is much lower than in Pathway 1, because the compression and purification unit used for carbon capture in Pathway 2 requires only 0.18 GJ of electricity per metric ton of cement.
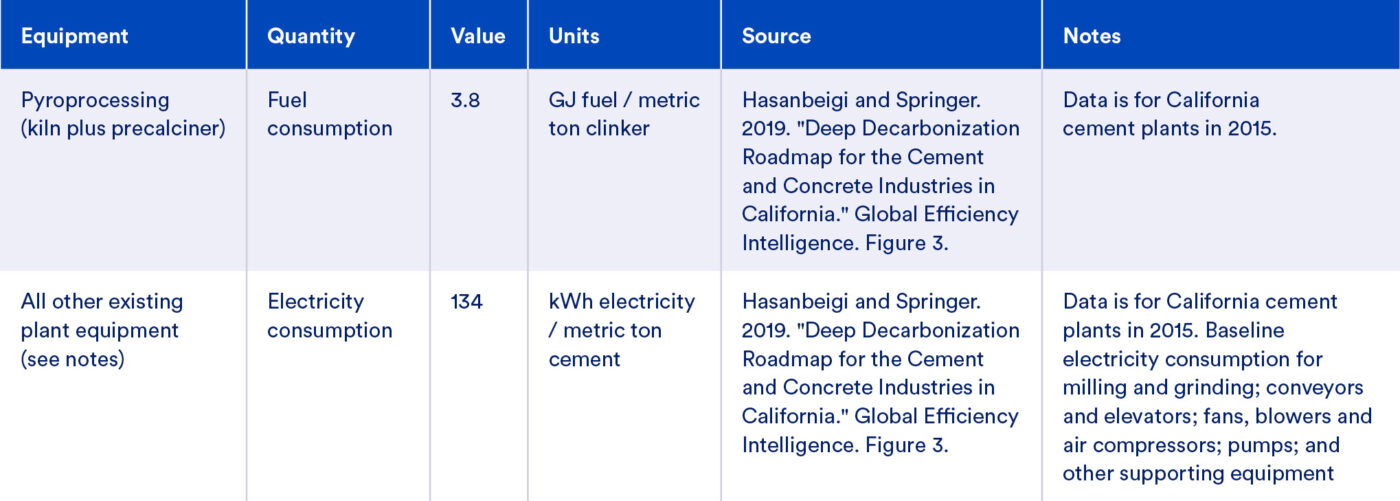
Like Pathway 1, Pathways 3 and 4 also see an increase in energy consumption relative to the baseline, because they also use an amine-based CCS system. However, the adoption of LC3 in Pathways 3 and 4 reduces their energy intensity relative to Pathway 1, consuming 0.2 GJ of electricity and 1.8 GJ of natural gas per metric ton of cement. Because clay calcination takes place at a lower temperature than clinker production, the energy intensity of calcined clay is less than half that of clinker (1.8 GJ per t calcined clay compared to 3.8 GJ per t clinker). The substitution of calcined clay for a portion of the clinker in LC3 reduces the energy intensity of cement produced in Pathways 3 and 4 directly. This substitution also reduces the energy consumption of the CCS system in Pathways 3 & 4 because less fuel combustion and lower process emissions result in less CO2 in the plant’s exhaust stream that must be captured.
The alternative fuels modeled—woody biomass and EMSW—both have a similar but slightly lower CO2 emissions factor (t CO2 per GJ) than both petcoke and coal;68 this means the increased use of alternative fuels in Pathway 4 slightly reduces the amount of CO2 in the plant’s exhaust stream. This effect on energy consumption is negligible due to the similarity in CO2 emissions factors and consequently, the amount of energy that the CCS system consumes between pathways 3 and 4 are nearly identical. After accounting for both LC3 production and alternative fuel use, CCS energy consumption in Pathways 3 and 4 is 2.0 GJ per metric ton of cement (compared to 3.4 GJ per t cement in Pathway 1).
Figure 14: Input energy requirement per metric ton of cement in each pathway
Capital costs
Table 8 shows capital costs by scenario. For purposes of modeling, we assumed that CCS capital costs scale in proportion to the quantity of CO2 that the system captures annually, while kiln and precalciner costs scale in proportion to annual clinker or calcined clay production.
Of the four non-baseline scenarios, Pathway 1 has the highest capital costs, mainly driven by the large capacity of its CCS system, which costs $251 million (2024$).69 In Pathway 2, the electric kiln costs $62.6 million (2024$), which is nearly three times the cost of a conventional kiln, and the electric precalciner adds an additional $39 million (2024$) in capital costs. However, the compression and purification unit costs only $54 million (2024$), about a fifth of the CCS costs in Pathway 1.
Similarly to energy consumption, the capital costs of Pathways 3 and 4 fall partway between Pathways 1 and 2. The cost of an additional rotary kiln and raw material storage for clay calcination is relatively minor at $11.5 million and is partially offset by savings in the cost of the lower-capacity rotary kiln for clinker production. As in Pathway 1, the CCS system dominates capital costs in Pathways 3 and 4 and costs an average of $198.1 million. Pathway 3 and 4 capital costs also increase cement production in this pathway, which could increase plant revenue. Capital costs to implement alternative fuels were not considered as the baseline facility already consumes some level of alternative fuels, but in practice could result in additional costs to Pathway 4.
Table 8: Capital costs by pathway
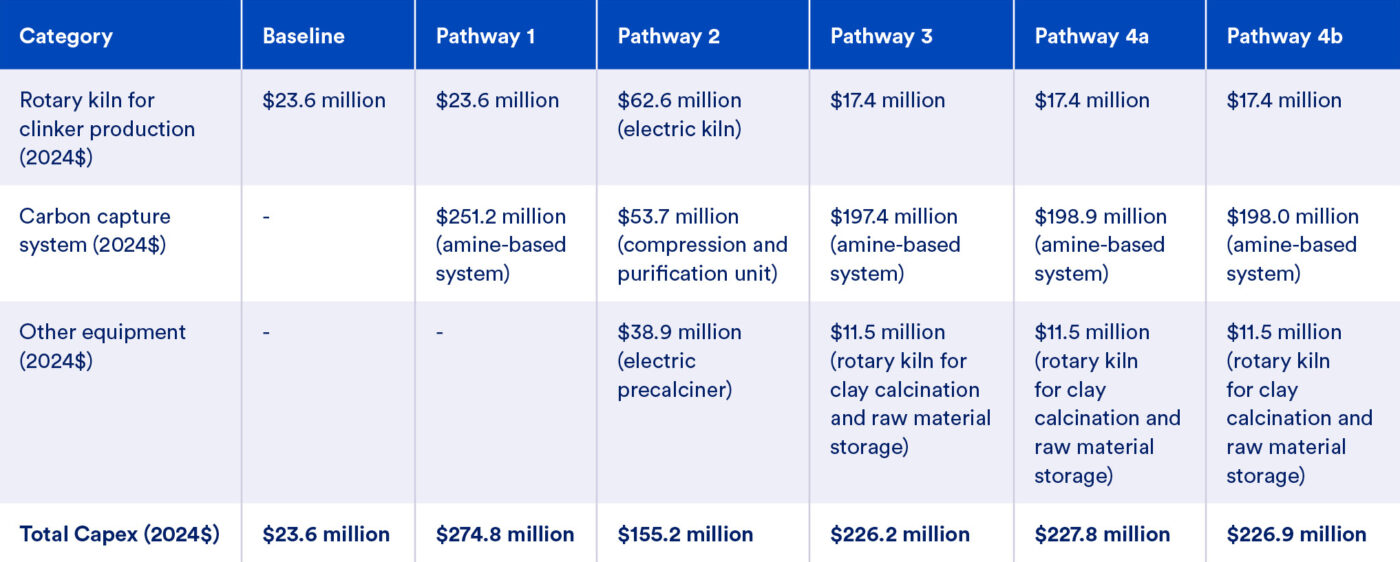
Notes: The baseline scenario includes the cost of a new rotary kiln because we assume that in all scenarios, the existing rotary kiln at the representative facility has reached end-of-life and needs replacement. Pathway 3 and 4 capital costs also increase cement production in these pathways, which could increase plant revenue.
Other Implementation Considerations
Technical feasibility
The decarbonization technologies discussed above vary in terms of their technological maturity. Amine-based carbon capture is the most technologically mature type of carbon capture equipment, but it is not yet widely deployed in the cement sector.70 The U.S. Department of Energy classifies these technologies as having a TRL of 6–7.5.71 Early examples of this technology include Heidelberg Materials’ Brevik cement plant in Norway and Anhui Conch’s cement plant in Baimashan, China.72 Because CCS is at an early stage of deployment in the cement sector, the range of uncertainty around its cost and performance is large. The cost of operating CCS also depends on the availability of infrastructure to transport captured CO2 to a location that has suitable geology for long-term storage.
The electrified precalciner and kiln modeled in Pathway 2 are at an earlier stage of development and have TRLs in the range of 5–6,73 with electric precalciners representing the higher end of this range due to their lower temperature requirement compared to electric kilns.74 The lower TRL indicates additional uncertainty around the cost and performance of these technologies once they are ready for deployment at scale.
LC3 produced in Pathways 3 and 4 is a fairly mature technology with a TRL of 7–9, but it faces regulatory barriers to deployment related to construction and procurement standards and market acceptance.75 The cement industry has historically been slow to adopt new cement formulations, even when they have equivalent performance to OPC, as a result of prescriptive materials standards and the customer adoption of performance-based material standards, risk aversion, and the need for workforce training to implement and verify new formulations.76 That said, the share of consumption of blended cements relative to total consumption increased rapidly beginning in 2021, showing that adoption of alternative cement blends will occur following periods of research, development, and deployment.77
In contrast to CCS and electrified precalciners and kilns, alternative fuels consumed in Pathway 4 are already commonly used at U.S. and European cement plants. In 2022, the California cement sector received about 9% of its energy from biomass waste fuel32 and 6% from tires.78 While alternative fuels are a mature technology that cement plants often adopt for their cost savings alone, they can also have limited direct CO2 emissions abatement potential depending on the emissions factor of the fuel, as discussed above. Additionally, the use of EMSW faces some permitting barriers as well as regulatory barriers in California related to the state’s definition of whether this qualifies as diverting the waste from a landfill.79 Other potentially attractive alternative fuels, such as agricultural by-products,80 may not face the same regulatory barriers but can increase on-site emissions due to potential higher emission factors (greenhouse gases released per unit of energy). Finally, hydrogen could be used in the future as an alternative fuel at cement plants, although it is at an earlier stage of deployment than the other alternative fuels discussed above. The economics of green hydrogen are currently challenging relative to other fuels, and achieving a high level of hydrogen blending would likely require reconfiguration of existing plant equipment.81
Air quality impacts
In addition to greenhouse gas abatement, air quality impacts are an important consideration for cement decarbonization technologies. All stages of the cement production process release PM, although the largest source of PM2.5 (particles less than 2.5 micrometers, which pose more serious health risks) is crushing and grinding. Approximately 97% of NOX emissions from cement plants in California are from the kiln and precalciner.33 Fuel burning in the kiln and precalciner can also lead to NOX emissions. Cement manufacturing also produces sulfur dioxide (SO2), carbon monoxide, and a variety of other toxic air contaminants in smaller quantities.
The choice of fuels used on-site affects emissions of criteria air pollutants and toxic air contaminants from cement plants. The impacts by fuel are as follows:82, 83
- Petcoke has the highest SO2 emissions (because of its high sulfur content), as well as high levels of NOX, PM, and heavy metal emissions. This fuel has the worst impact on local air quality among common cement fuels.84
- Coal is a substantial source of SO2 and PM, and a moderate source of NOX and heavy metals. It provides the baseline emission profile for most cement kilns.
- Natural gas results in no SO2 or heavy metal emissions and very low particulates, but higher thermal NOX due to high flame temperatures.
- Biomass produces lower NOX, SO2, and PM emissions than fossil fuels because of its low nitrogen and sulfur content and cleaner combustion. Emission levels depend on biomass type and fuel quality control.
- Engineered municipal solid waste results in highly variable emissions. When well-processed, it can lead to lower SO2, NOX, and particulate emissions than coal or petcoke. It requires strong quality control as pollutant levels depend on waste composition and preprocessing.
- Tire-derived fuel typically lowers NOX and PM compared to conventional fossil fuels; sulfur is present, but much is absorbed into the cement product. Some unique heavy metals, such as zinc, may be incorporated into the clinker instead of emitted directly.85
In addition to the fuel used, the addition of amine-based CCS to a cement plant affects toxic air contaminant emissions. Amine-based CCS increases on-site combustion of natural gas through the addition of the auxiliary boiler, which is a potential source of NOx and toxic air contaminants. CCS can also be a direct source of emissions, such as VOCs, from breakdown of amine solvent.88 On the other hand, CCS often necessitates installation of additional air pollution controls, particularly for SO2, to avoid solvent degradation, which can result in net reductions in some air pollutant emissions.86
Clean Air Task Force’s 2023 study of the expected air quality impacts of proposed retrofitting of two existing U.S. cement plants (including one in California) with CCS found that both plants would need to install add-on controls to reduce the amount of SO2 and PM in the waste gas stream that passes through the CCS unit. The addition of these controls together with CCS virtually eliminated SO2 emissions and reduced PM emissions by more than 90% at both plants.Reductions in PM emissions would also reduce the emissions of associated hazardous air pollutants, including metals (compounds containing arsenic, cadmium, chromium (VI), cobalt, lead, beryllium), particulate divalent mercury, manganese chloride and selenium compounds. However, emissions of VOCs such as amine and amine degradation products may increase with the addition of the CCS system.87, 88 While no additional NOx controls were added, small reductions of around 2% were seen due to the absorption of NO2 in the amine solvent. CATF found that CCS installation at these facilities would be expected to significantly improve public health compared to continued unabated operations due to net reduction in pollution.
Finally, SCMs can reduce toxic air contaminant emissions if the material being substituted has lower emissions than the clinker it replaces. The traditional process for limestone calcination emits substantial NOX, SO2, and particulates due to the high-temperature process, fuel combustion, and the decomposition of limestone.89 In contrast, clay calcination kilns operate at reduced temperature with less energy demand and avoid decomposition of limestone, resulting in less thermal NOX, SO2, and PM compared to limestone calcination.90 LC3 adoption therefore tends to reduce emissions of these toxic air contaminants.
Modeling in this study does not include a quantitative analysis of the air quality impacts of the decarbonization pathways. Qualitatively, considering the combined impact of the factors above, all pathways would likely offer net air quality benefits:
- In Pathway 1, the addition of CCS will necessitate add-on pollution controls that will reduce SO2 and PM emissions, as described above. Emissions of VOCs related to the amine-based solvent would likely increase slightly.91
- Full electrification in Pathway 2 eliminates on-site production of toxic air contaminants associated with fuel combustion. Process-related emissions of pollutants such as PM would still occur in this pathway.
- In Pathways 3, adoption of LC3 will also reduce thermal NOX, SO2, and PM by substituting calcined clay for a portion of the clinker. Finally, installation of amine-based CCS in this pathway will have similar impacts to Pathway 1; add-on pollution controls will offer deep reductions in SO2 and PM emissions, but VOC emissions may increase.
- Pathway 4 builds on the improvements from LC3 and CCS in Pathway 3. The shift from coal and petcoke to biomass and EMSW generally reduces SO2, NOX, and PM, if the alternative fuel and controls are well-managed.
Emerging CCS Technologies
In addition to the CCS technologies considered in this study, there are other emerging CCS technologies that could be applied to cement production.
Oxyfuel combustion
Instead of combustion air, the cement kiln is fired using a mixture of oxygen and CO2, producing a flue gas consisting primarily of CO2 and water. This process requires electricity to power the production of oxygen via air separation, as well as potential modifications to the cement kiln and burner design. However, it avoids the need for a steam supply and industrial chemical plants on site. Because the flue gas is concentrated in CO₂, oxyfuel operation enables high rates of capture with simpler downstream purification, typically achieved through cryogenic cooling and distillation of liquid CO2. Conversion of existing cement kilns is often known as ‘1st generation oxyfuel’, while purpose-built kilns can be specially designed to use a higher proportion of oxygen, making them smaller and more efficient. This ‘2nd generation’ oxyfuel is being trialed under the ‘Catch4Climate’ project at Mergelstetten in Germany.92 Oxyfuel has dominated recent cement plant plans in Europe, having been selected by ten of the cement decarbonization projects successfully awarded funding under the EU’s Innovation Fund93 scheme. The technology has also been demonstrated at a relatively large scale (200,000 tons CO2/year) at a cement plant in Qingzhou, China.94
Solid Sorbent Capture
Cement flue gas can also be treated in vessels filled with solid sorbent materials that selectively bind the CO2. In a process known as pressure swing adsorption (PSA), lowering the pressure in the vessel can then release the CO2. However, the released stream generally requires further CO2 purification. Air Liquide’s CryoCapTM FG technology, which Holcim is planning to use to capture CO2 at the Kujawy Cement Plant in Poland, uses PSA followed by a cryogenic process for further purification and production of liquid CO2.95 Other kinds of sorbents can instead be heated to release the CO2, known as ‘temperature swing adsorption’. Linde’s HISORP® CC technology, which CEMEX is planning to use at the Rüdersdorf Cement Plant in Germany, is based on this process.96
LEILAC (Low Emissions Intensity Lime and Cement)
LEILAC is not a CCS technology in and of itself, but rather an alternative calcination method that is designed to facilitate efficient carbon capture. The LEILAC process features a redesigned kiln that is heated indirectly, leading to a nearly pure stream of process CO2 emissions that are separate from other flue gases. The process can use various fuels or electricity to provide heat to the kiln via specialized steel tubes surrounding an inner channel for material inputs. The CO2 stream can be captured by various CCS technologies, but with lower energy penalty and capital costs due to the purity of the stream. LEILAC is at a TRL of 5-6, with pilot plants already being tested. The LEILAC1 pilot project in Lixhe, Belgium, successfully demonstrated the LEILAC technology at a Heidelberg Cement plant in 2019 without impacting the quality or production of the cement. LEILAC2 aims to scale the technology to capture 100,000 t CO2 per year at a Heidelberg Cement plant in Germany, pairing the LEILAC technology with alternative fuels (biomass).97 LEILAC’s ability to retrofit existing cement plants makes it a potential option for California’s cement industry, but will depend on the technology’s demonstration at scale and site-specific integration factors.
Cryogenic Capture
Cryogenic CO2 capture involves cooling the flue gas to very low temperatures, causing the CO2 to change directly into a solid state through deposition. This process typically uses compression and refrigeration systems to lower the temperature of CO2 to below its freezing point, separating it from other gases in the exhaust stream. The CO2 is melted from solid to liquid for transport. This technology is distinct from the cryogenic processing of liquid CO298 which takes place at higher temperatures and is applied to concentrated CO2 streams, such as those from cement kilns with key modifications (e.g. LEILAC, electrified kilns, oxyfuel). Cryogenic capture is at an early stage of development (TRL 3-4). Chart Industries’ Cryogenic Carbon Capture process has been demonstrated at the Sugar Creek Cement Plant in Missouri in a small-scale pilot (one metric ton per day).99 Carbon America is developing FrostCCTM, a similar cryogenic capture technology. The high purity of the CO2 captured through this method would enable its effective storage or utilization. However, the high energy demand due to the need for significant cooling associated with cryogenic systems may pose a challenge for applications in California’s cement industry.
Calcium Looping
Calcium looping is an emerging post-combustion carbon capture technology for the cement industry that captures CO₂ by reacting it with lime (calcium oxide, or CaO) in a fluidized bed reactor called a carbonator, forming limestone (calcium carbonate, CaCO₃). The limestone is then calcined in a separate unit to release a pure CO₂ stream and regenerate CaO for reuse. This process is essentially the reverse of the LEILAC approach and can be configured as either an end-of-pipe system or integrated with the cement plant. The CLEANKER project at the Buzzi Unicem cement plant in Vernasca, Italy, demonstrated calcium looping in a pilot with a carbonator and an oxyfuel calciner.100 One advantage of calcium looping is that the carbonation step is exothermic, allowing for potential heat recovery. Calcium looping is currently at TRL 4–6 and offers relatively high CO₂ capture efficiency (up to 90%). However, retrofitting a conventional cement plant with calcium looping faces challenges including increased thermal energy demand, high capital costs, and site-specific integration that must be addressed before full-scale deployment.101
Implications for policy and future analysis
Achieving deep decarbonization of cement in California will require deployment of numerous decarbonization technologies. Each of the pathways modeled in this report can achieve deep decarbonization in the cement sector but at widely varying costs. These costs may change over time as decarbonization technologies mature, feedstock and electricity prices change, and as facilities implement partial carbon reduction strategies. Facilities looking to decarbonize will face site-specific implementation challenges and associated costs which were outside of the scope of this report. Each pathway faces cost gaps, where current financial incentives for decarbonization are not adequate for deep decarbonization. These cost gaps highlight the need for strong decarbonization policy in California to support cement sector decarbonization and to achieve carbon neutral cement by 2045.
Additional considerations around decarbonization pathways include lifecycle GHG impacts of alternative fuels and non-GHG emissions impacts of all decarbonization technologies. This study focused on Scope 1 and 2 emissions impacts of cement production, but future work should explore emissions impacts of different alternative fuels on a lifecycle basis. Additionally, while this study qualitatively explored non-GHG emissions impacts of each decarbonization pathway and technology, future analysis should determine quantitative impacts to local air quality and non-GHG emissions for each decarbonization technology and pathway.
Appendix: California Cement Techno-Economic Analysis: Summary of Model Inputs
Note: Values presented in this report are illustrative only. They are not based on vendor quotes or measured data and should not be interpreted as precise or operationally representative. All input values are reproduced from the source material, with limited rounding or modification, to maximize transparency and replicability. Results should be interpreted accordingly.
Parameters of Typical Facility
Annual Clinker and Cement Production and Kiln Replacement Costs
Fuel Mix for Pyroprocessing (percent of total BTU)
Baseline fuel mix reflects average for cement plants in California, however “biomass waste fuel” in the 2022 data is assumed to be woody biomass for the purposes of this modeling. Calculated from CARB emissions inventory data for 2022.
Financial Parameters
Cement Composition (percent by weight)
The representative facility produces OPC in Pathways 1 and 2 and LC3 in Pathways 3, 4A, and 4B.
LC3. (2019). Financial Attractiveness of LC3. https://lc3.ch/wp-content/uploads/2020/10/2019-LC3FinancialAttractiveness-WEB.pdf; Global Efficiency Intelligence. (2019). California’s Cement Industry: Failing the Climate Challenge. https://www.climateworks.org/wp-content/uploads/2019/02/CA-Cement-benchmarking-report-Rev-Final.pdf.
Clinker Production Inputs and Outputs
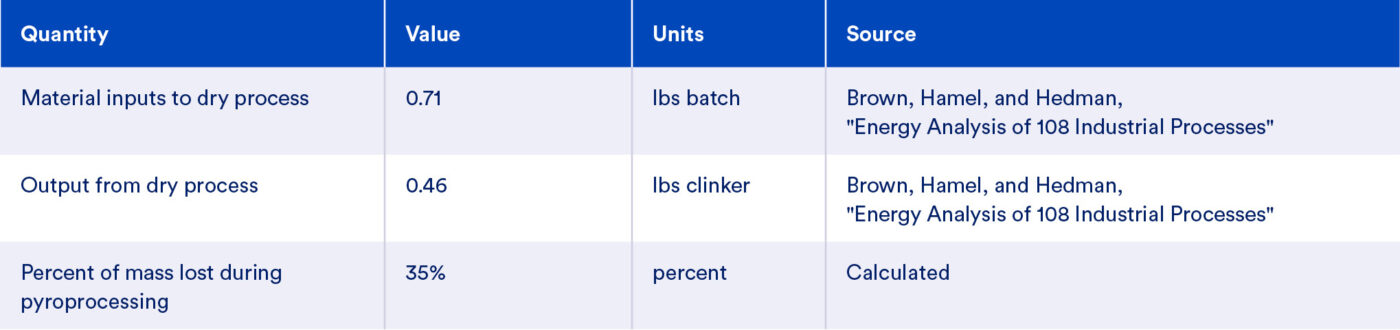
Composition of Batch Input to Pyroprocessing

Energy Use – Baseline Cement Production
Process Emissions Intensity

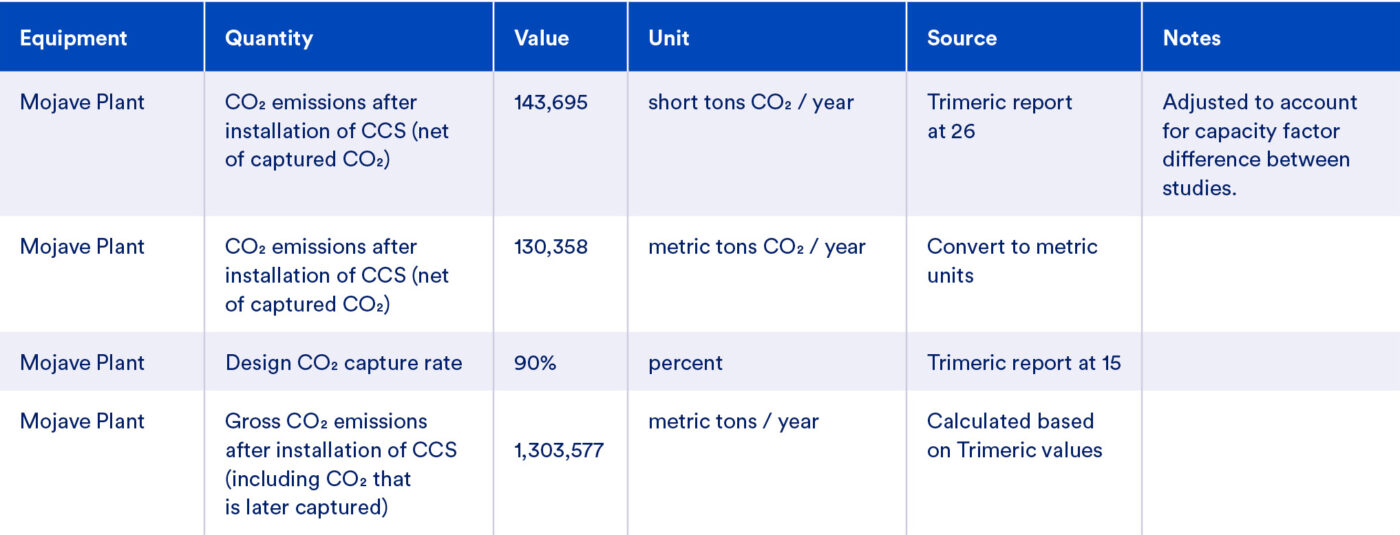
CCS Equipment Parameters Based on Mojave Plant Study of CCS Potential
GHG Emissions of Mojave Plant from CCS Potential Study
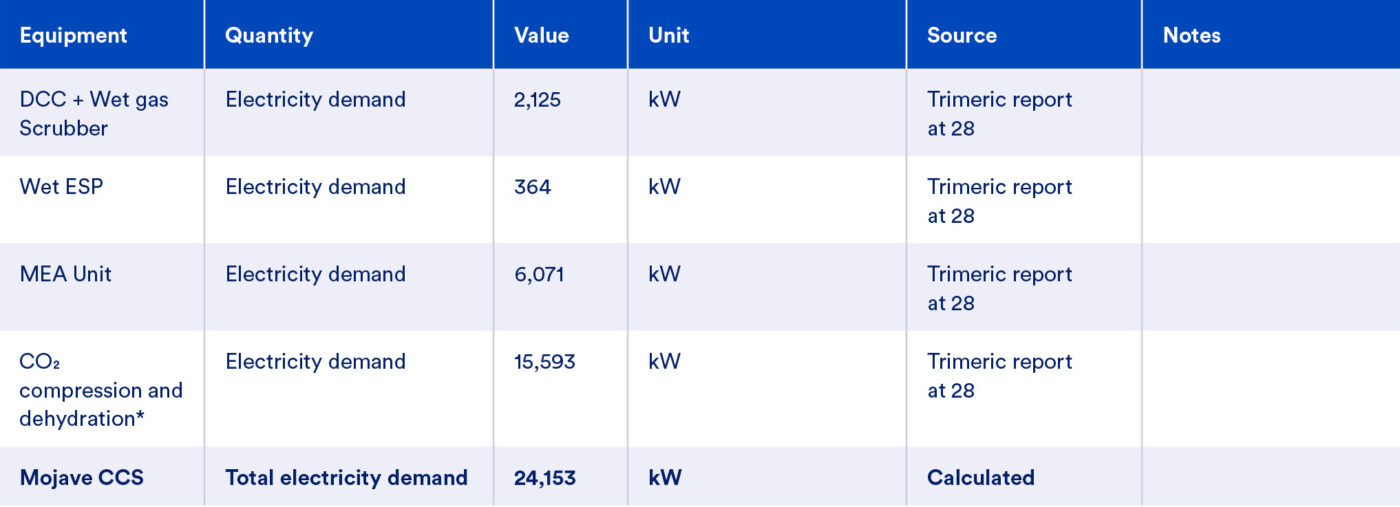
Electricity Demand of Mojave CCS Equipment from CCS Potential Study
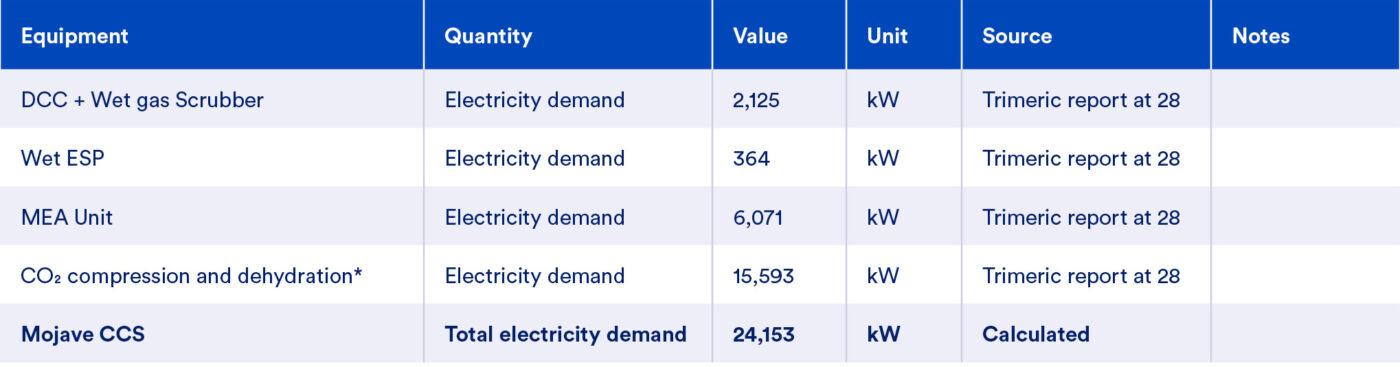
Electricity Demand of Mojave CCS Equipment from CCS Potential Study
Fuel Consumption of CCS Auxiliary Boiler based on Mojave Potential Study
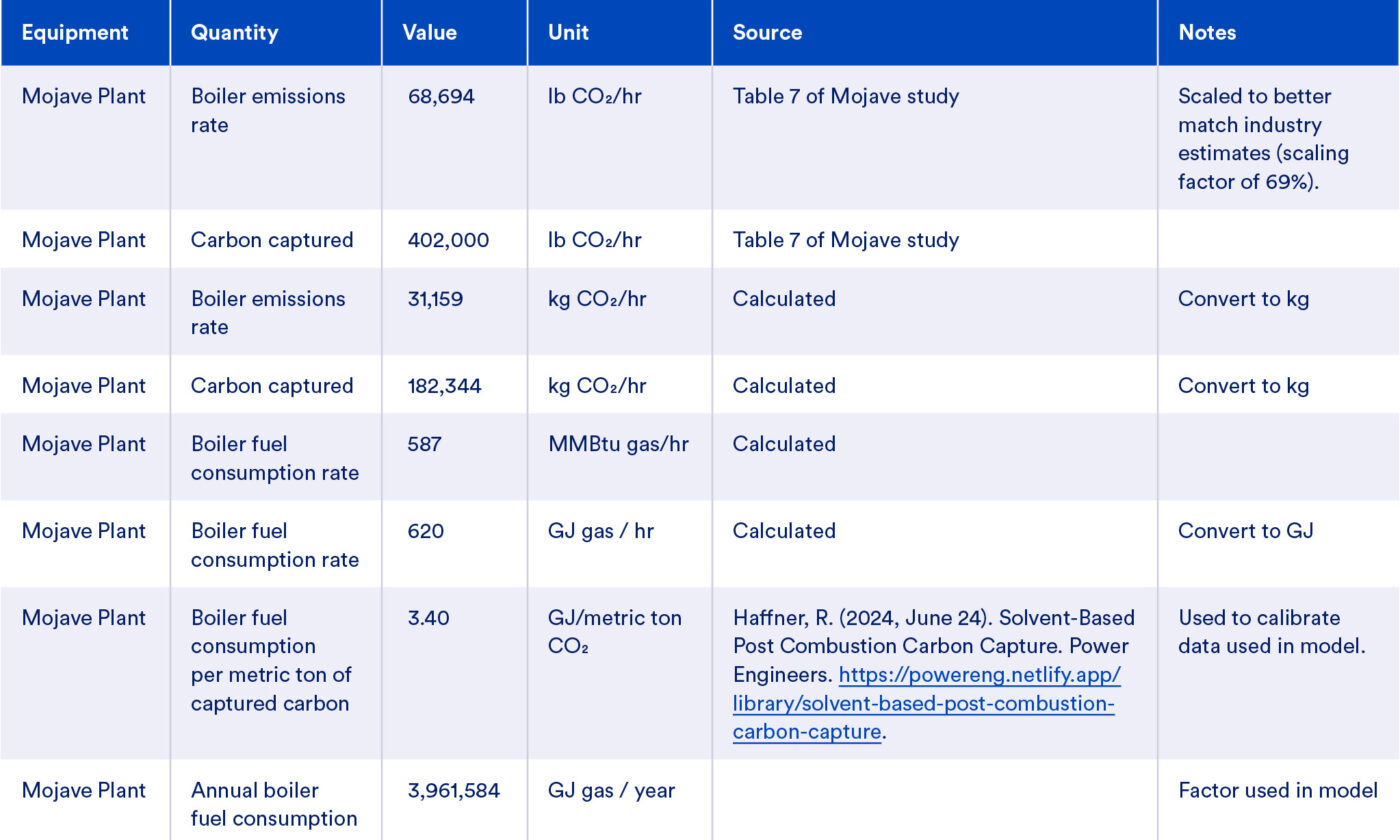
Sizing of CCS Auxiliary Boiler

CCS Electricity Demand per Ton of CO2 based on Mojave Potential Study

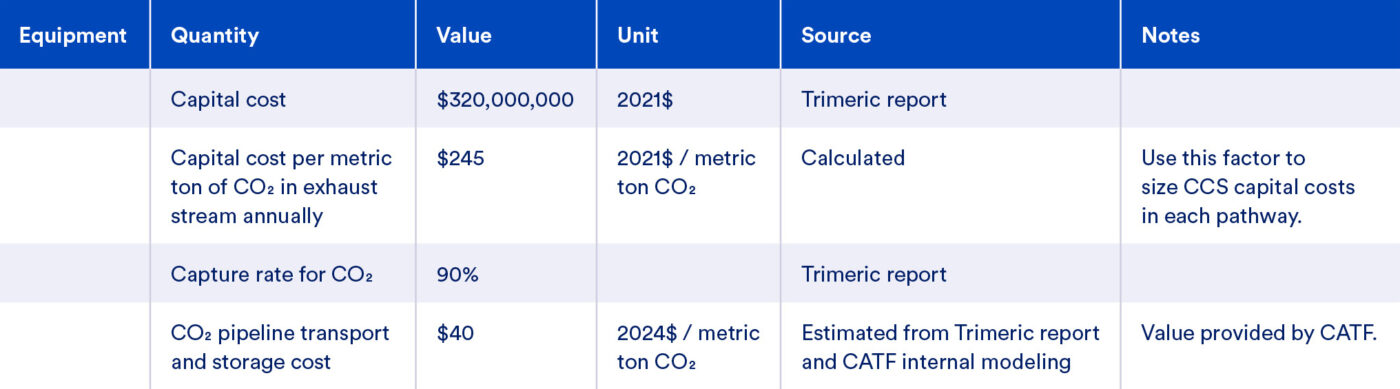
CCS Cost and Performance based on Potential Study
Electrification-Related Inputs
Alternative Fuel Inputs
In Pathway 4A, the representative facility increases its use of woody biomass up to the maximum substitution rate, replacing baseline coal and petcoke consumption. In Pathway 4B, the representative facility begins burning engineered municipal solid waste (EMSW) up to the maximum substitution rate, again replacing baseline coal and petcoke consumption. Both scenarios assume that the plant already has equipment for alternative fuel combustion on-site, so no additional capital expenditures are necessary to enable alternative fuel adoption.
Supplementary Cementitious Material (LC3) Inputs
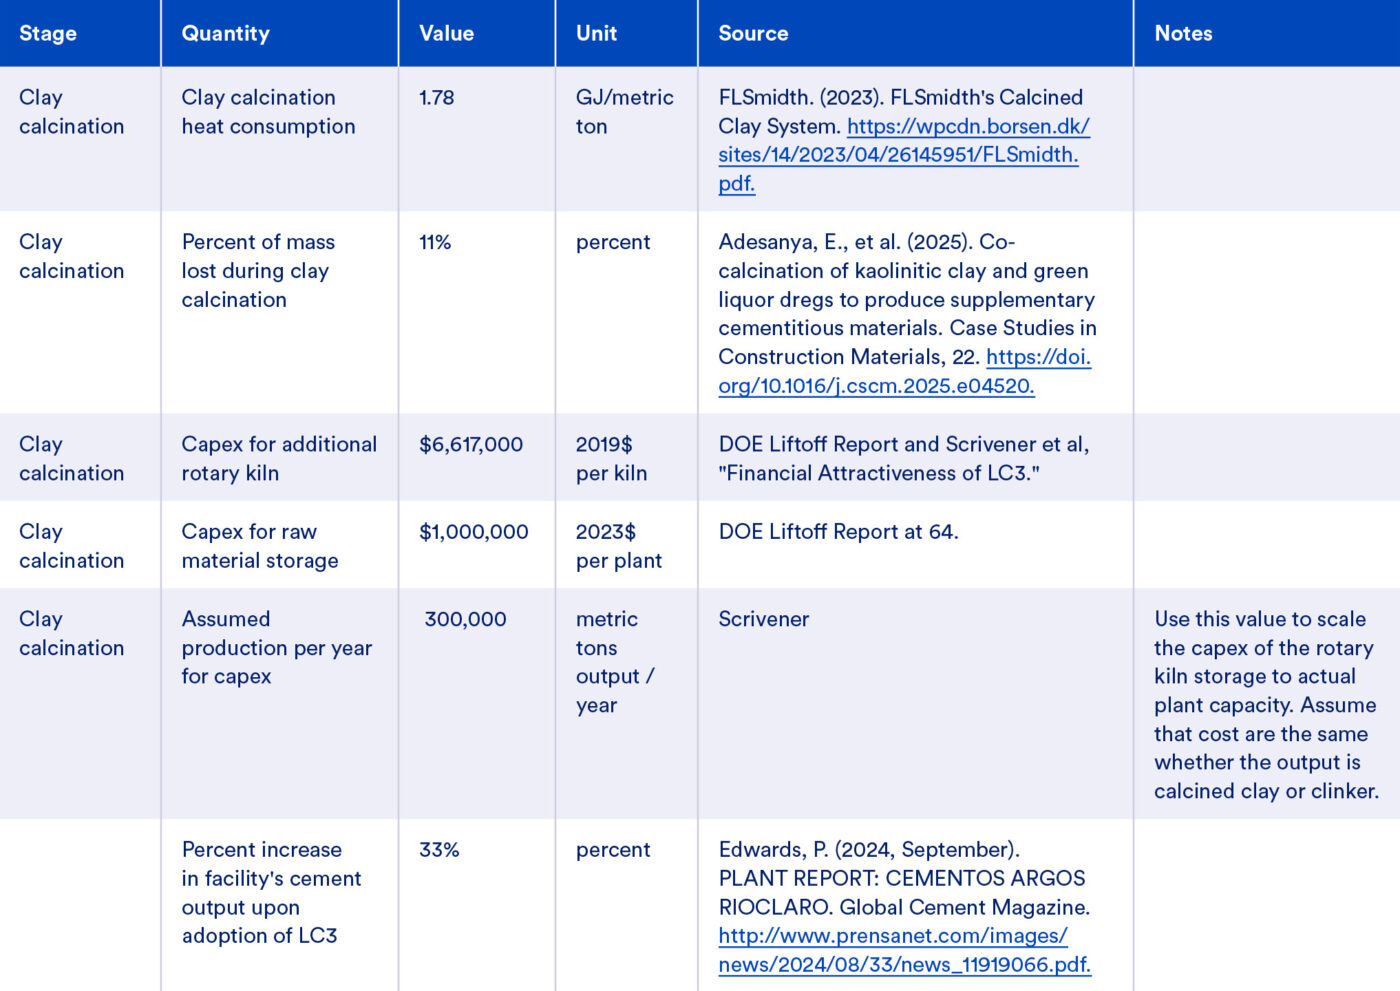
The representative facility produces LC3 in Pathways 3, 4A, and 4B. Pathway 3 represents adoption of LC3 only, while Pathways 4A and 4B represent adoption of LC3 plus increased alternative fuel use as described above.
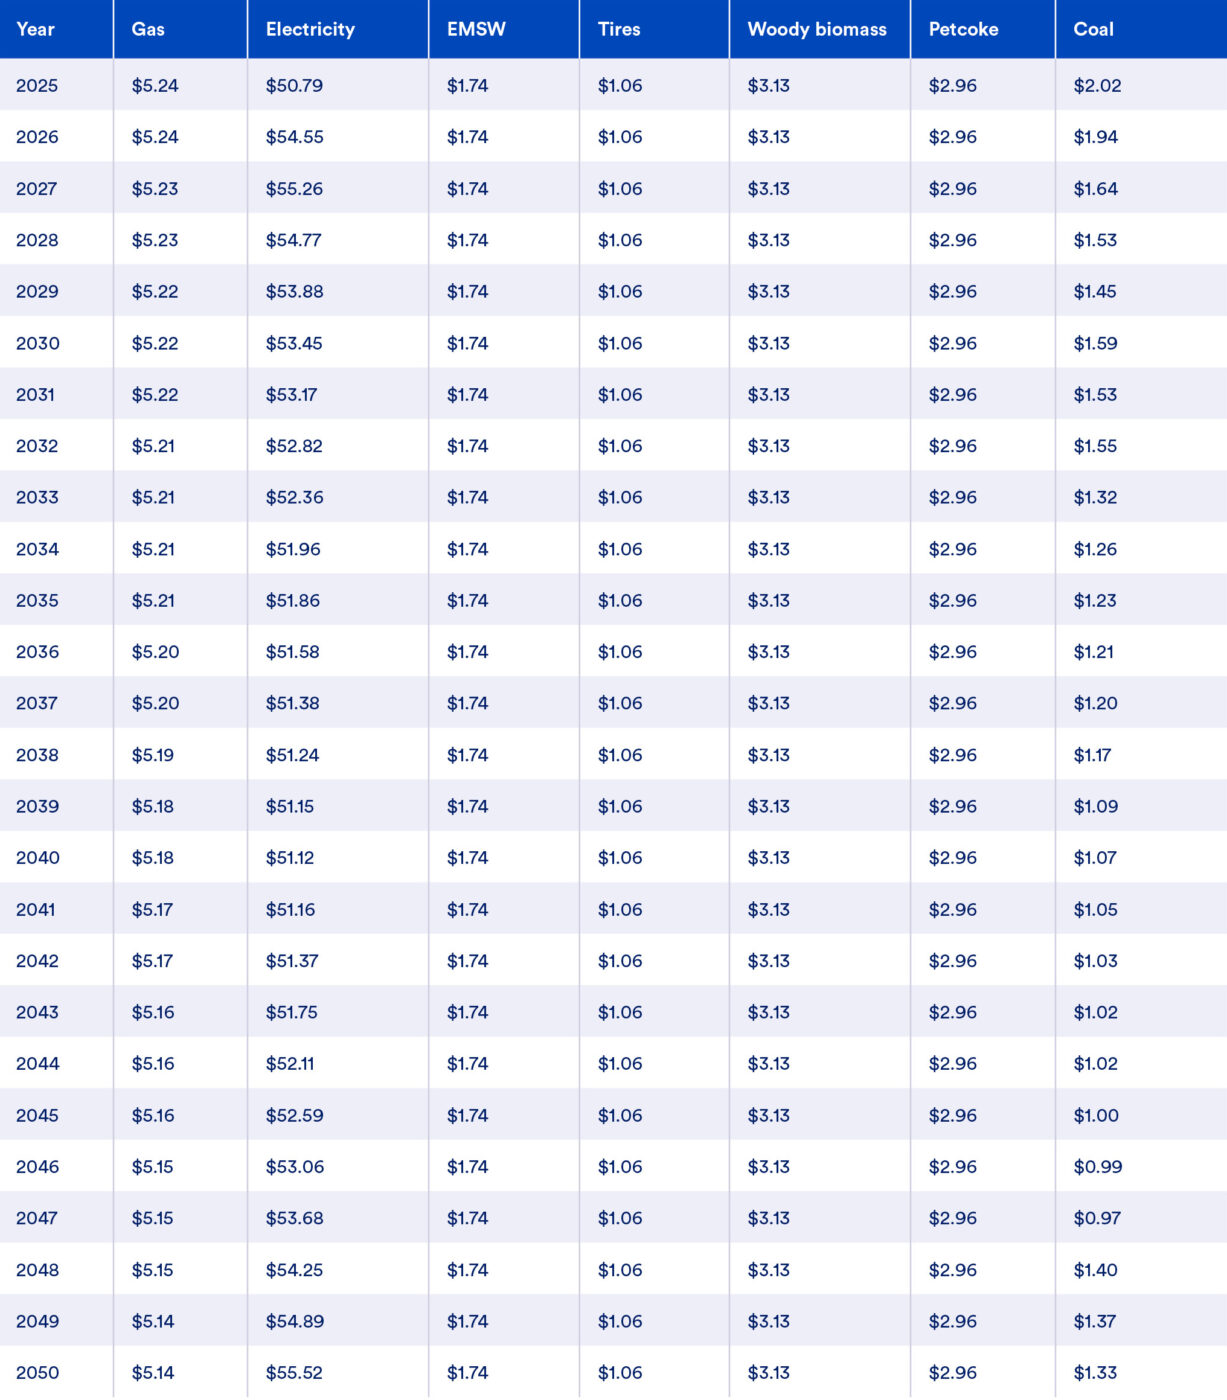
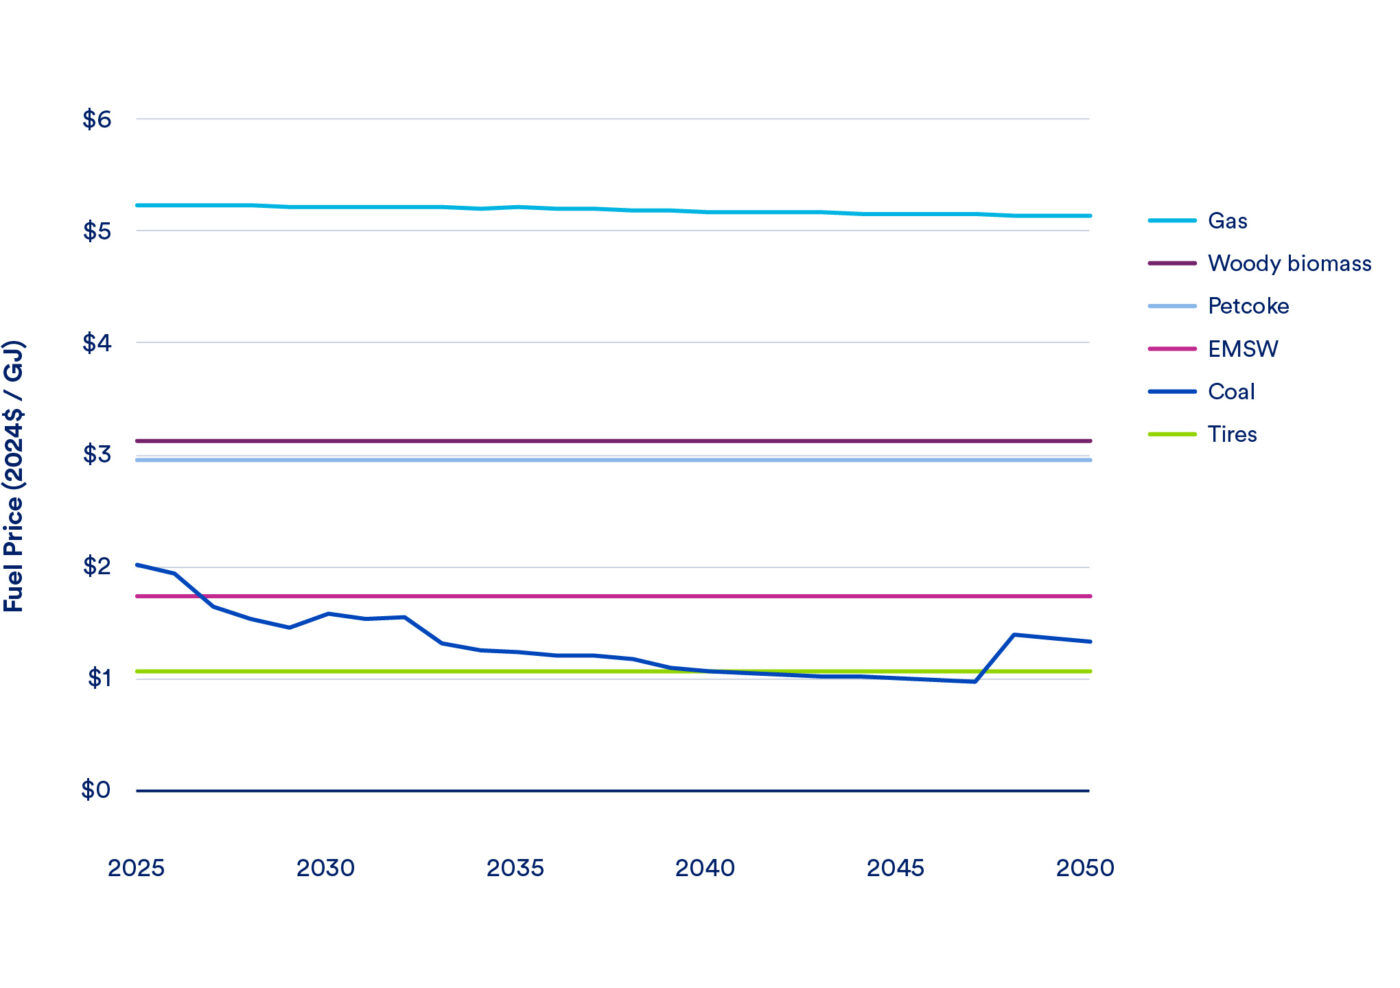
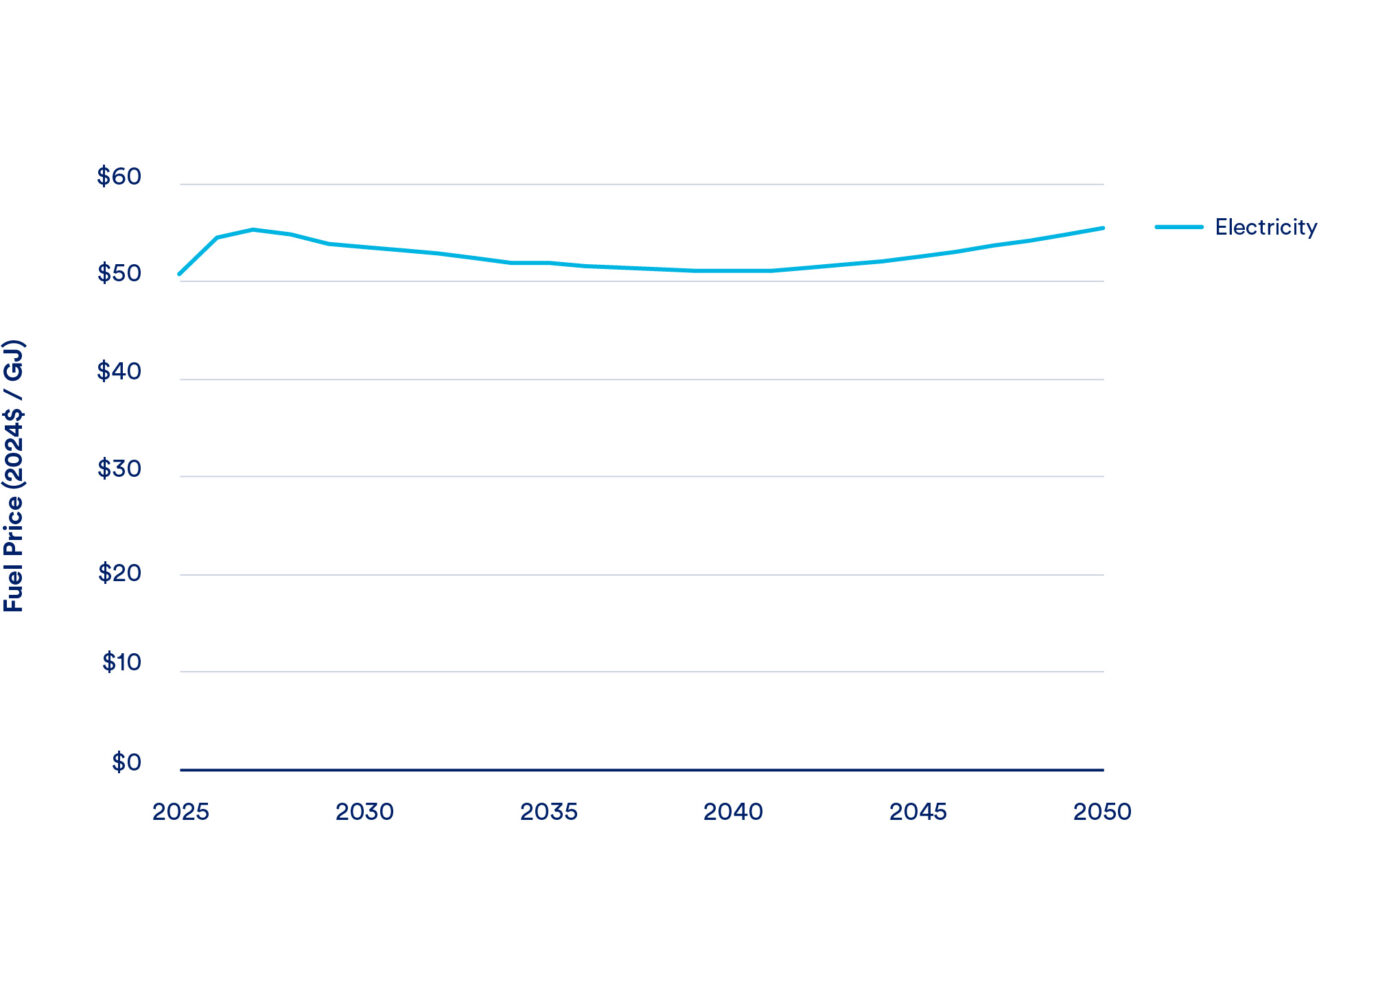
Energy Price Forecasts (2024 $ / GJ)
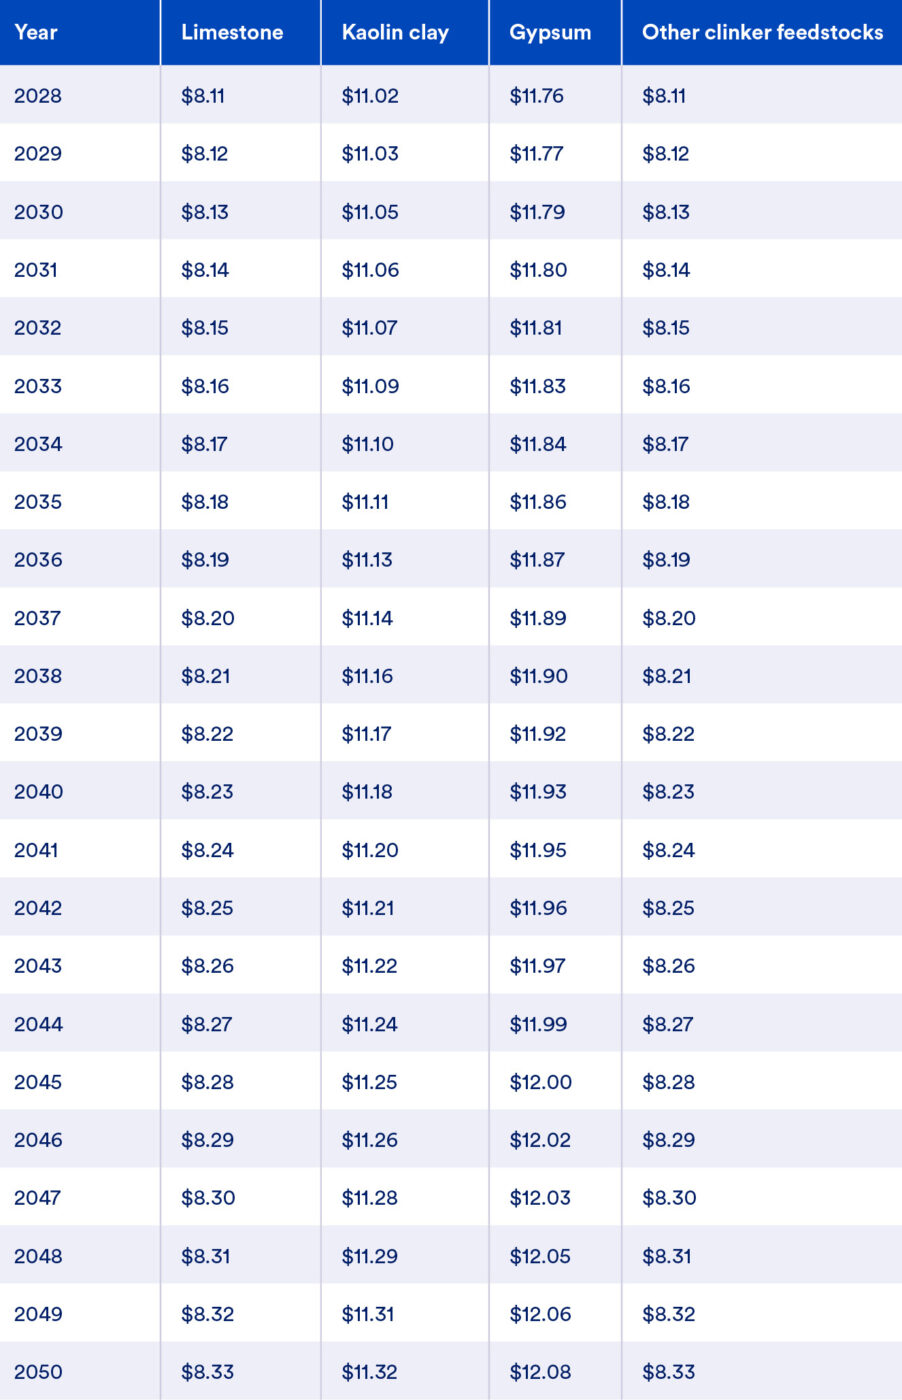
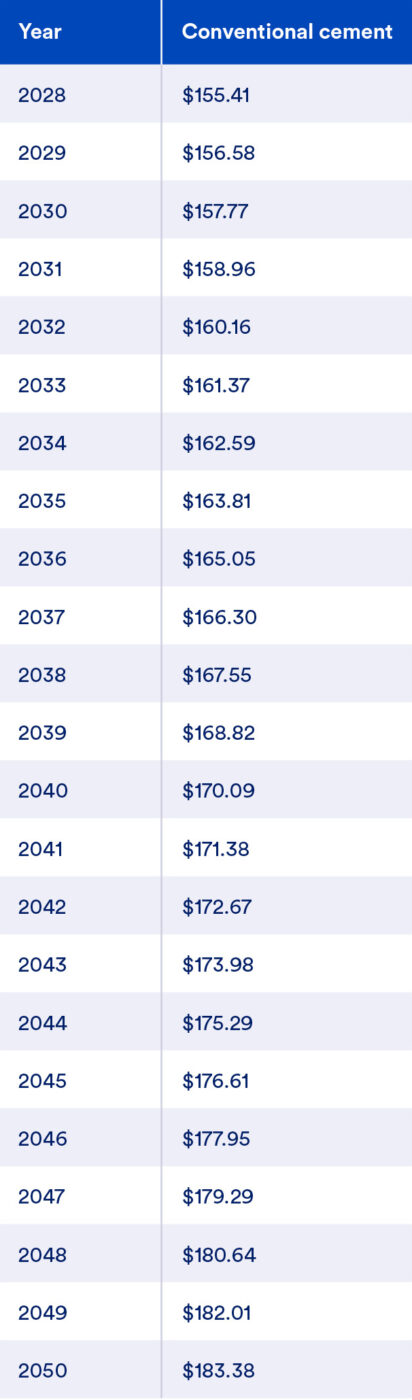
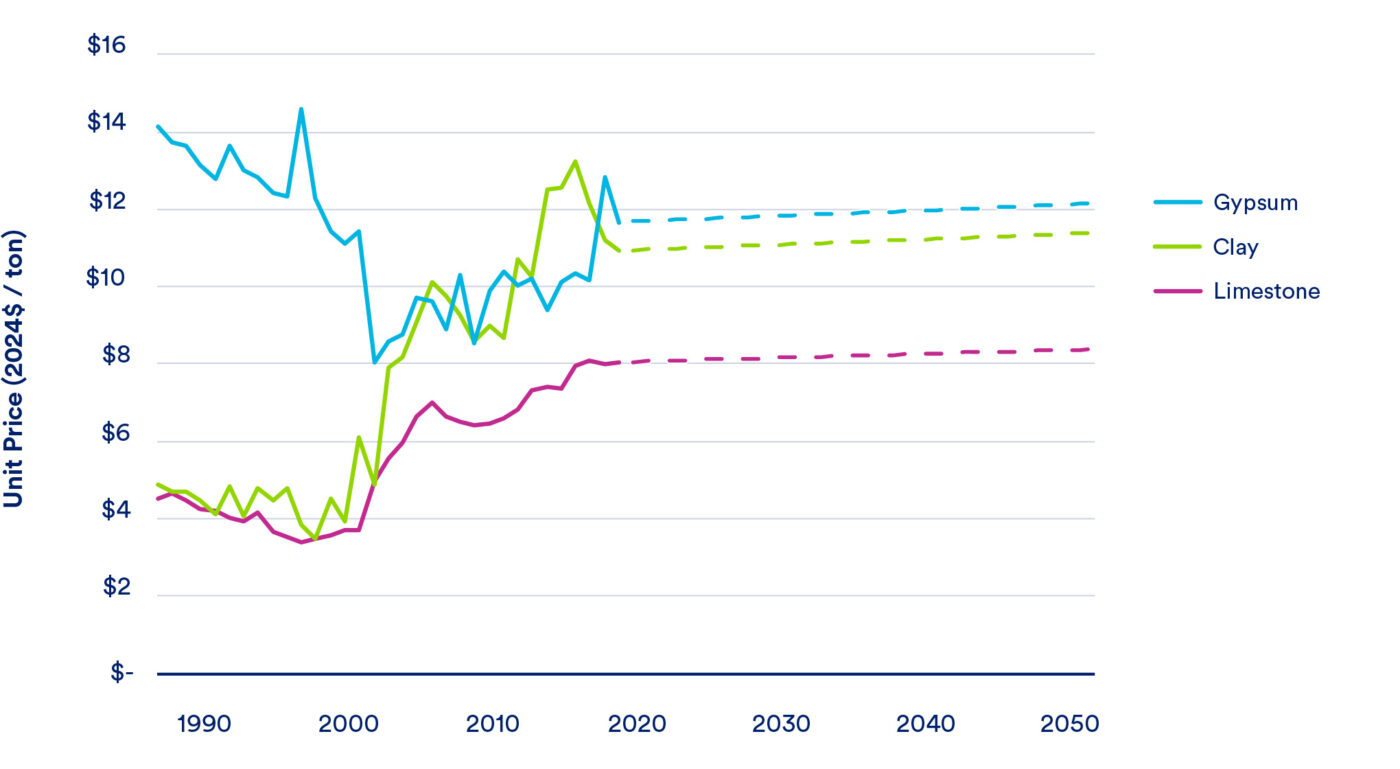
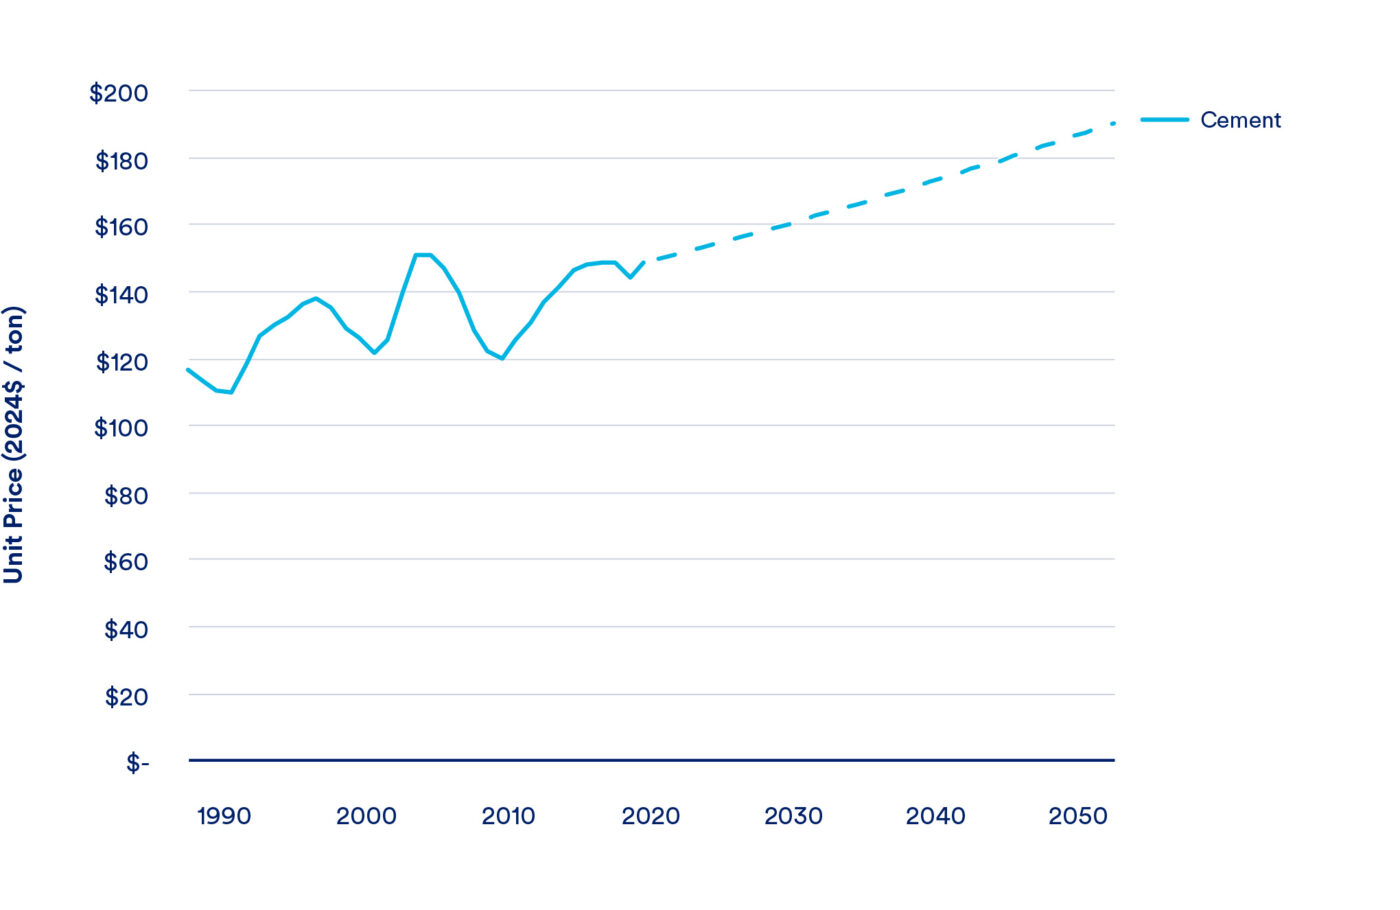
Methodology: Synapse projected materials prices using data from the USGS Mineral Yearbook, assuming historic CAGRs will remain constant in the future. We adjusted the price data for limestone and clay to remove transportation costs and profit margins, following the methodology from the DOE liftoff report, and reduced these materials’ CAGR to avoid unrealistic long-term growth in real value.
Materials Price Forecasts (2024$ / metric ton)
Methodology: Electricity prices are the 2025-2050 projections from the California Energy Commission’s most recent Demand Side Modeling. Coal prices through 2050 are sourced from the U.S. EIA’s 2025 Annual Energy Outlook. Petcoke prices are from the U.S. EIA’s Electric power monthly data for fuels cost (due to a lack of data on petcoke prices specific to the industrial sector). Woody biomass fuel costs are based on state-specific U.S. EIA fuels forecasts. The cost of tires and engineered MSW are based on values found across literature, business analytic platforms, and government studies. The price of EMSW, tires, woody biomass, and petcoke are held constant in real terms going forward.
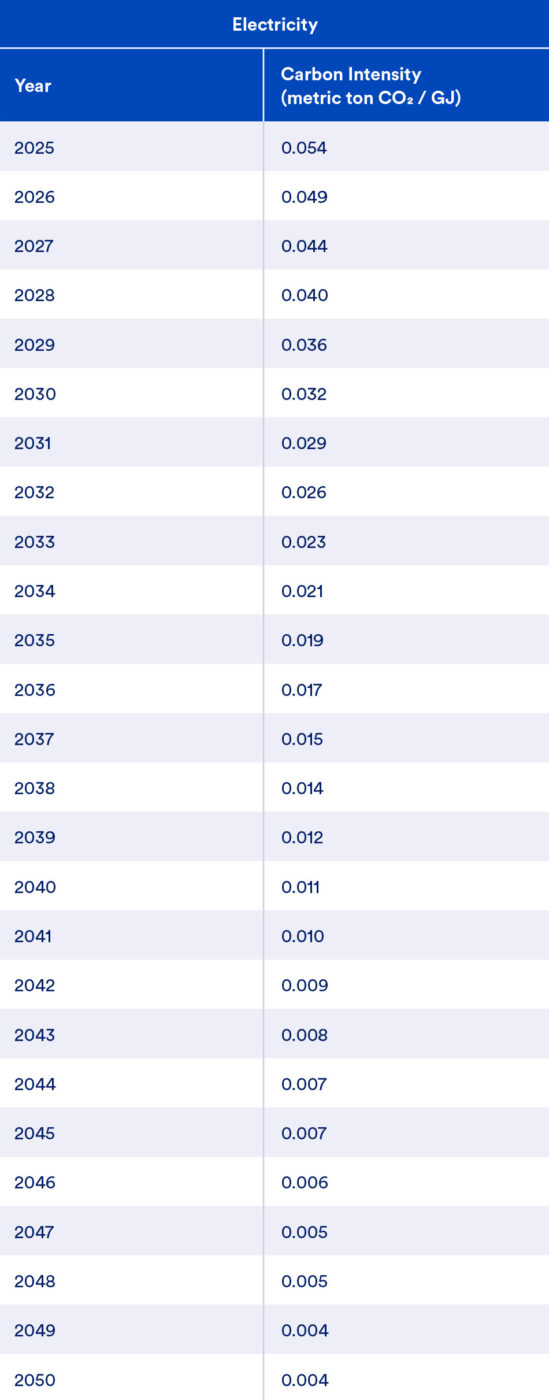
Fuel Emissions Factors & Electricity Carbon Intensity (metric ton CO2 / GJ)
Fuel Methodology: Emissions intensities for all fuels are from the 2025 GHG Emission Factors Hub, available at: https://www.epa.gov/climateleadership/ghg-emission-factors-hub. Woody biomass uses the emissions intensity for Wood and Wood Residuals.
Electricity Methodology: Synapse calculated the electricity emissions intensity using the CAISO-specific average annual long-term marginal emissions rate data from NREL Cambium’s MidCase scenario.
Footnotes
- California Air Resources Board. (2025). Draft Net-Zero Greenhouse Gas Emissions Strategy for the California Cement Sector. https://ww2.arb.ca.gov/sites/default/files/2025-03/Draft%20Net-Zero%20GHG%20Emissions%20Strategy%20for%20the%20Cement%20Sector.pdf.
- California Air Resources Board. (2025). Draft Net-Zero Greenhouse Gas Emissions Strategy for the California Cement Sector, 34. https://ww2.arb.ca.gov/sites/default/files/2025-03/Draft%20Net-Zero%20GHG%20Emissions%20Strategy%20for%20the%20Cement%20Sector.pdf.
- Research from UC Davis also highlight these technologies. Kim, A. & Miller, S. (2023). Meeting industrial decarbonization goals: a case study of and roadmap to a net-zero emissions cement industry in California. Environmental Research Letters, 18(104019). https://doi.org/10.1088/1748-9326/acf6d5. Other decarbonization pathways exist including non-limestone routes that may not require CCS, but these technologies are generally at lower technology readiness levels (TRLs) and are better suited for greenfield cement plants rather than a facility retrofit.
Other scenarios, such as incorporating LC3 production into an electrification with CCS scenario is possible but would require further analysis of facility integration and available process information. For this analysis, this combination of technologies was not analyzed.
The Lebec Net-Zero Project is planning to use locally sourced biomass as an alternative fuel. National Cement. (2024). National Cement of California Finalizes Agreement with Department of Energy for development of the Lebec Net-Zero Project. https://www.nationalcement.com/news-main/lebec-net-zero-project.
Intergovernmental Panel on Climate Change (IPCC) (Ed.). (2023). Summary for Policymakers. In Climate Change 2022 – Mitigation of Climate Change: Working Group III Contribution to the Sixth Assessment Report of the Intergovernmental Panel on Climate Change. https://doi.org/10.1017/9781009157926.001.
The carbon intensity of CA’s grid follows the CAISO-specific average annual long-term marginal emissions rate data from NREL Cambium’s MidCase scenario. See the Technical Appendix for yearly carbon intensity values.
Note, this result is highly sensitive to the price of electricity, which, according to U.S. EIA data for 2023, was 2.3 times as costly in California compared to the national average for industry. U.S. EIA. (2023). State Energy Data System 2023: Prices and Expenditures, Table E5. Industrial sector energy price estimates, 2023. https://www.eia.gov/state/seds/sep_sum/html/pdf/sum_pr_ind.pdf.
Capital costs in the baseline are from kiln replacement. See Technical Appendix for additional details on cost assumptions.
However, the entire system must store more carbon in permanent or durable reservoirs than greenhouse gases it emits on a lifecycle basis to be considered actual biomass carbon removal and storage or carbon dioxide removal.
California has a target to implement wildfire fuel reduction treatments on between 1 and 2.3 million acres of forests and other lands annually by 2045. California’s Nature-Based Solutions Climate Targets. (2024). Appendix 1 – Methodology: California’s Nature-Based Solutions (NBS) Climate Targets, 8. https://resources.ca.gov/-/media/CNRA-Website/Files/Initiatives/Expanding-Nature-Based-Solutions/NBS-Climate-Targets-Appendix-1—Methodology.pdf.
CATF. (2025). Exploring Biomass Carbon Removal and Storage (BiCRS) Scenarios for California. https://www.catf.us/resource/exploring-biomass-carbon-removal-and-storage-scenarios-for-california/.
CATF reviewed the emissions impacts of installing CCS on the Mojave Cement Plant, which is applicable to Pathway 1. CATF. (2023).
Air Pollutant Reductions From Carbon Capture. https://www.catf.us/resource/air-pollutant-reductions-carbon-capture/.Portland Cement Association. (2019). U.S. Portland Cement Industry: Plant Information Summary. http://www2.cement.org/econ/pdf/Plant_Information_Summary_2019.pdf.
USGS. (Multiple.) Cement Statistics and Information.
https://www.usgs.gov/centers/national-minerals-information-center/cement-statistics-and-information.American Cement Association. (n.d.). CALIFORNIA: Cement Industry Impact.
https://www.cement.org/wp-content/uploads/2025/08/ACA_California_One-Sheet_08-25-25_v1.pdf.An 8th facility, the Hanson Permanente Facility, located in the Bay Area, closed in April 2020.
See discussion of decarbonization considerations for cement facilities with considerations for process type, kiln age, and production capacity. CATF. (2025). Recasting the Future: Policy Approaches to Drive Cement Decarbonization. https://www.catf.us/resource/recasting-future-policy-approaches-drive-cement-decarbonization/.
California Air Resources Board. (2024). California Greenhouse Gas Emissions from 2000 to 2022: Trends of Emissions and Other Indicators. https://ww2.arb.ca.gov/sites/default/files/2024-09/nc-2000_2022_ghg_inventory_trends.pdf.
CATF analysis of GHGRP Data (Part 98 Subpart C and Subpart H data). Data pulled from: U.S. EPA. (n.d.). GHG Query Builder. https://enviro.epa.gov/query-builder/ghg.
Global Efficiency Intelligence. (2019). California’s Cement Industry: Failing the Climate Challenge. https://www.climateworks.org/wp-content/uploads/2019/02/CA-Cement-benchmarking-report-Rev-Final.pdf.
While the lifetime of cement kilns are usually 30-50 years, existing kilns and their equipment are continually being modernized. European Cement Research Academy. (2022). The ECRA Technology Papers 2022 – State of the Art Cement Manufacturing – Current Technologies and their future development. https://api.ecra-online.org/fileadmin/files/tp/ECRA_Technology_Papers_2022.pdf.
Portland Cement Association. (2019). U.S. Portland Cement Industry: Plant Information Summary. http://www2.cement.org/econ/pdf/Plant_Information_Summary_2019.pdf.
Fugitive emissions from coal fuel storage are excluded.
California Air Resources Board. (2016). California’s 2000-2014 Greenhouse Gas Emission Inventory Technical Support Document.
https://ww2.arb.ca.gov/sites/default/files/classic/cc/inventory/ghg_inventory_tsd_00-14.pdf.California Air Resources Board. (2025). Documentation of California’s 2000-2023 GHG Inventory. https://ww2.arb.ca.gov/applications/california-ghg-inventory-documentation.
USGS. (2025). Mineral Industry Surveys: Cement in December 2024. https://www.usgs.gov/centers/national-minerals-information-center/cement-statistics-and-information.
California Air Resources Board. (2024). Fuel Activity for California’s AB 32 GHG Emissions Inventory by Sector & Activity.
https://ww2.arb.ca.gov/ghg-inventory-data. See also reference 27.CalRecycle & GHD Inc. (2025). California Waste Tire Market Report: 2023. Available at: https://calrecycle.ca.gov/tires/wastetirereport/.
Engineered municipal solid waste refers to waste converted through a process that meets the requirements laid out in Cal. Pub. Res. Code § 40131.2 (a) (West).
California Air Resources Board. (2024). Fuel Activity for California’s AB 32 GHG Emissions Inventory by Sector & Activity. https://ww2.arb.ca.gov/ghg-inventory-data.
CARB defines “biomass waste” as “Organic non-fossil material of biological origin that is a byproduct or a discarded product. ‘Biomass waste’ includes municipal solid waste from biogenic sources, landfill gas, sludge waste, agricultural crop byproducts, straw, and other biomass solids, liquids, and gases; but excludes wood and wood-derived fuels (including black liquor), biofuels feedstock, biodiesel, and fuel ethanol.” California Air Resources Board. GHG Inventory Glossary. https://ww2.arb.ca.gov/ghg-inventory-glossary. For the cement sector, this definition also includes wood and wood waste per CATF’s direct communication with CARB in 2026. Further breakdown of biomass waste fuel use is not publicly available for all years, however Figure 17 in the Draft SB 596 Cement Strategy shows that in 2019, 4% of energy consumption by fuel was from the “other category” including 2% from “forest-derived wood and wood waste,” 1% each from both “urban waste” and “engineered municipal solid waste,” and less than 1% from “agricultural waste.” California Air Resources Board. (2025). Draft SB 596 Cement Strategy, 42. https://ww2.arb.ca.gov/our-work/programs/net-zero-emissions-strategy-cement-sector/draft-sb-596-cement-strategy.
See reference 28.
AJW. (2024). California Cement Plant Permit and Emissions Review: Findings.
https://ajw-inc.com/data-market-insights/cement-plant-emissions-and-permit-review-in-california/.U.S. EPA. (n.d.). CO-Benefits Risk Assessment Health Impacts Screening and Mapping Tool (COBRA).
https://www.epa.gov/cobra (Version 4.0 was used, with 2023 as the analysis year).California’s regulatory classification of TACs includes all federally identified hazardous air pollutants, but may include additional compounds and apply more stringent limits. California Air Resources Board. (n.d.). CARB Identified Toxic Air Contaminants.
https://ww2.arb.ca.gov/resources/documents/carb-identified-toxic-air-contaminants.Fortera. (n.d.). ReCarb® Plants. https://forteraglobal.com/recarb-plant/.
Fortera. (n.d.). ReAct® Product. https://forteraglobal.com/react-product/.
Carsen, W. (2024, July 17). Cutting-Edge Projects Aim to Decarbonize US Cement Emissions. https://www.wri.org/insights/low-carbon-cement-technology; see reference 18. Research from CATF and LLNL highlight how CCS might apply to cement plants in CA. Grove, B., Peridas, G. (2023). Sharing the Benefits: How the Economics of Carbon Capture and Storage Projects in California Can Serve Communities, the Economy, and the Climate. Lawrence Livermore National Laboratory. https://gs.llnl.gov/sites/gs/files/2023-05/ca-ccs-economic-study-report.pdf.
- U.S. Department of Energy. (2023). Industry Guide to Carbon Capture and Storage at Cement Plants. https://www.energy.gov/sites/default/files/202311/Industry%20Guide%20to%20CCS%20at%20Cement%20Plants_Nov%2029%202023_0.pdf.
National Concrete Pavement Technology Center. (n.d.). Cementitious Materials. https://www.cptechcenter.org/cementitious-materials/.
See reference 18.
Portland Cement Association. (2024). State-of-the-Art Report on Use of Limestone in Cements at Levels of up to 15%.
https://www.cement.org/wp-content/uploads/2024/06/2024-SN3148.03.pdf.See CA plants in list for “Type IL Blended Cement.” Caltrans. (2026). Cementitious Materials for use in Concrete. https://mets.dot.ca.gov/aml/CementitiousList.php.
USGS. (2024, 2025). Mineral Commodity Summaries.
https://www.usgs.gov/centers/national-minerals-information-center/mineral-commodity-summaries.Kaolinite clay is calcined at 700-800 °C whereas clinker production can reach temperatures up to 1,450 °C. LC3 has a composition of 50% clinker, 30% calcined clay, 15% limestone, and 5% gypsum and has been shown have promising performance compared with Ordinary Portland Cements. LC3. (n.d.). A Sustainable alternative for the cement industry. https://lc3.ch/wp-content/uploads/2023/02/LC3-A-sustainable-alternative-FINAL-EN-WEB2-2023.pdf.
See reference 18.
U.S. Department of Energy. (2025). Transformative Pathways for U.S. Industry: Unlocking American Innovation.
https://www.energy.gov/sites/default/files/2025-01/transformative-pathways-for-us-industry.pdf.See reference 22.
See reference 14.
Kiln replacement was included in the Baseline scenario to levelize between pathways. Given the likelihood that some of these plants will need to replace their kilns in the next 50 years, we assume a kiln replacement. Cement plants are also likely to make capital improvements simultaneously to minimize the amount of downtime. No energy efficiency improvement or emissions reductions were considered as a direct result of kiln replacement.
See Appendix for more details. California Air Resources Board. (n.d.). Current California GHG Emissions Inventory Data. https://ww2.arb.ca.gov/ghg-inventory-data. Baseline fuel mix reflects average for cement plants in California, however “biomass waste fuel” is assumed to be woody biomass (in terms of emissions factor) for the purposes of this modeling.
The SB 596 baseline defines a metric for GHG intensity and selects a year (2019) from which to set and measure against intermediate carbon reductions progress. 2021 California Senate Bill No. 596, California 2021-2022 Regular Session. For the purposes of the modeling, the most recent (2022) average fuel mix from CARB emissions inventory data, nameplate production capacity for clinker (PCA, 2019), capacity factor (USGS 2023 Cement Minerals Yearbook) were used to calculate carbon intensity metrics for the Baseline scenario.
A carbon capture rate of 90% was selected to represent a lower-bound, as first-of-a-kind projects are likely to seek permits for 90% capture or higher. Higher capture rates (>90%) are technically achievable and are often the target of cement CCS projects and FEED studies, such as those in Europe and in the U.S. (95%). Du, Y., Gao, T., Rochelle, G., Bhown, A. (2021). Zero- and negative-emissions fossil-fired power plants using CO₂ capture by conventional aqueous amines. International Journal of Greenhouse Gas Control. 111. https://doi.org/10.1016/j.ijggc.2021.103473; CATF. (2025, November 26). Carbon capture and storage in Europe: Slow but significant progress in 2025. https://www.catf.us/2025/11/carbon-capture-storage-europe-slow-but-significant-progress-2025/; Salih, H., OBrien, K., and Dreyer, D., Guerif, P., Henderson, T., Clarridge, A., Lofgreen, B., Donovan, A., Slettehaugh, B., Roberts, D. (2022). FEED Study for Retrofitting Holcim U.S. Cement Facility with CO₂ Capture Plant Using Air Liquide Adsorption Assisted Cryogenic Technology. Proceedings of the 16th Greenhouse Gas Control Technologies Conference (GHGT-16). https://dx.doi.org/10.2139/ssrn.4291335.
To achieve a greater than 90% capture rate, an amine-based CCS system could be added to the kiln in Pathway 2 to capture the dilute stream of CO2 (2.9% volume, dry basis) due to the process emissions combined with the plasma gas. We did not model that option here due to the increase in costs that would result.
Pathway 4a is similar to National Cement’s Industrial Demonstration Program Project Proposal, however Pathway 4a uses woody biomass whereas National Cement suggest they may use agricultural byproducts such as pistachio shells. National Cement Company of California. (n.d.). National Cement Finalizes Agreement With Department of Energy for Development of the Lebec Net-Zero Project. Lebec Net-Zero Project. https://lebecnetzero.com/latest-news/natcem-finalizes-doe-agreement. The emissions factor for woody biomass is assumed to be that of Wood and wood residuals per the technical appendix.
EMSW was selected as an alternative fuel given its lower CO₂ emissions factor compared to biofuels, its inclusion in the California Nevada Cement Association’s (CNCA) report as one of two refuse-derived fuels with the highest potential to displace fossil fuel use, the relatively certain supply of EMSW, and its limited interactions with use of arable land. While the EMSW would need to meet the requirements of Cal. Pub. Res. Code § 40131.2, quantitative analysis of EMSW’s contribution to toxic air contaminants was outside the scope of this analysis and should be analyzed further. According to CNCA, EMSW can replace up to roughly 30% of a plant’s fuel mix. California Nevada Cement Association. (2023). Achieving Carbon Neutrality in the California Cement Industry: Key Barriers & Policy Solutions. https://static1.squarespace.com/static/65255bbe3f377e609244546f/t/6571fa23c11add2d88b8cc7d/1701968419719/cnca_carbonneutrality_secondedition_vfinal_07_19_23_.pdf.
Carbon intensity of CA’s grid follows the CAISO-specific average annual long-term marginal emissions rate data from NREL Cambium’s MidCase scenario. See Technical Appendix for yearly carbon intensity values.
CATF. (2025). Exploring Biomass Carbon Removal and Storage (BiCRS) Scenarios for California. Available at: https://www.catf.us/resource/exploring-biomass-carbon-removal-and-storage-scenarios-for-california/.
Biogenic CO2 accounting performed by CATF.
California Air Resources Board. (2016). California’s 2000-2014 Greenhouse Gas Emission Inventory Technical Support Document.
https://ww2.arb.ca.gov/sites/default/files/classic/cc/inventory/ghg_inventory_tsd_00-14.pdf.California Air Resources Board. (2016). California’s 2000-2014 Greenhouse Gas Emission Inventory Technical Support Document.
https://ww2.arb.ca.gov/sites/default/files/classic/cc/inventory/ghg_inventory_tsd_00-14.pdf; CO2 emissions from combustion of certain fuels are exempt from Cap-and-Trade compliance obligations, effectively treating them as carbon neutral. Cal. Admin. Code tit. 17, § 95852.2; Net GHG reductions are equal to the amount of injected CO2 minus the CCS project CO2e emissions. California Air Resources Board. (2018). Carbon Capture and Sequestration Protocol under the Low Carbon Fuel Standard. https://ww2.arb.ca.gov/sites/default/files/2020-03/CCS_Protocol_Under_LCFS_8-13-18_ada.pdf.California Air Resources Board. (2025). Draft Net-Zero Greenhouse Gas Emissions Strategy for the California Cement Sector. https://ww2.arb.ca.gov/sites/default/files/2025-03/Draft%20Net-Zero%20GHG%20Emissions%20Strategy%20for%20the%20Cement%20Sector.pdf.
California Air Resources Board. (2025). Draft Net-Zero Greenhouse Gas Emissions Strategy for the California Cement Sector. https://ww2.arb.ca.gov/sites/default/files/2025-03/Draft%20Net-Zero%20GHG%20Emissions%20Strategy%20for%20the%20Cement%20Sector.pdf.
Note that California’s electricity prices are some of the highest in the nation, so the magnitude of the cost increase in Pathway 2 would be lower if the representative facility were located in a different state.
Adesanya, E., et al. (2025). Co-calcination of kaolinitic clay and green liquor dregs to produce supplementary cementitious materials. Case Studies in Construction Materials, 22. Available at: https://doi.org/10.1016/j.cscm.2025.e04520.
Dombrowski, K., Jones, C. (2022). CATF Study on Links between Carbon Capture and Conventional Air Pollutants: Summary of Cost and Performance Estimations for CO2 Capture Technology and Pre-treatment Air Pollution Controls for Cement Sources. Trimeric Corporation.
Fuel CO2 emissions factors (t CO2 per GJ) for coal (0.090), petcoke (0.097), woody biomass (0.089), tires (0.081), EMSW (0.086), natural gas (0.050). See Technical Appendix for more information.
Amine-based CCS system costs are sourced from the Trimeric report underlying the 2023 Air Pollutant Reductions from Carbon Capture Report. Trimeric developed Association for Advancement of Cost Engineering (AACE) Class 5 cost estimates for amine-based CO2 capture unit and add-on pre-treatment controls using site-specific (Mojave Cement Plant) flue gas characteristics. The resulting capital cost of $320M ($2021) was then scaled to match the representative facility on the assumptions that CCS cost is proportional to CCS system capacity, CCS system capacity is proportional to the maximum instantaneous flow rate of CO2 through the system, and peak instantaneous CO2 flow rate is proportional to annual CO2 emissions. In addition, capacity factor differences between the studies (95% in Trimeric report versus 73% from USGS California) were used to scale the costs. See appendix for other CCS cost assumptions. CATF. (2023). Air Pollutant Reductions From Carbon Capture. Available at: https://www.catf.us/resource/air-pollutant-reductions-carbon-capture/.
Haffner, R. (2024, June 24). Solvent-Based Post Combustion Carbon Capture. Power Engineers. https://powereng.netlify.app/library/solvent-based-post-combustion-carbon-capture.
U.S. Department of Energy. (2023). Pathways to Commercial Liftoff: Low-Carbon Cement. https://climateprogramportal.org/wp-content/uploads/2025/02/20230921-Pathways-to-Commercial-Liftoff-Cement.pdf.
Heidelberg Materials. (2025, June 18). World premiere at Heidelberg Materials: Opening of CCS facility in Norway marks new era of sustainable construction. https://www.heidelbergmaterials.com/en/pr-2025-06-18.; Global Cement and Concrete Association.; Global CCS Institute. (2024, July 15). China begins operations at the world’s largest oxy-fuel combustion CCUS project in cement sector.
https://www.globalccsinstitute.com/china-begins-operations-at-the-worlds-largest-oxy-fuel-combustion-ccus-project-in-cement-sector/.TRL 5 indicates that technologies are ready to be tested at the lab scale. TRL 6 indicates that prototypical systems are ready to be tested at the pilot scale.
U.S. Department of Energy. (2023). Pathways to Commercial Liftoff: Low-Carbon Cement. https://climateprogramportal.org/wp-content/uploads/2025/02/20230921-Pathways-to-Commercial-Liftoff-Cement.pdf.
Mañosa, J., Calderón, A., Salgado-Pizarro, R., Maldonado-Alameda, A., and Chimenos, J. (2024). Research evolution of limestone calcined clay cement (LC3), a promising low-carbon binder – A comprehensive overview. Heliyon, 10, 3.
Available at: https://doi.org/10.1016/j.heliyon.2024.e25117.CATF. (2025). Recasting the Future: Policy Approaches to Drive Cement Decarbonization. Available at: https://www.catf.us/resource/recasting-future-policy-approaches-drive-cement-decarbonization/.
American Cement Association. (2024). State-of-the-Art Report on Use of Limestone in Cements at Levels of up to 15%. https://www.cement.org/wp-content/uploads/2024/06/2024-SN3148.03.pdf.
California Air Resources Board. (2024). Fuel Activity for California’s AB 32 GHG Emissions Inventory by Sector & Activity. https://ww2.arb.ca.gov/ghg-inventory-data.
California Nevada Cement Association. (2023). Achieving Carbon Neutrality in the California Cement Industry: Key Barriers & Policy Solutions. https://static1.squarespace.com/static/65255bbe3f377e609244546f/t/6571fa23c11add2d88b8cc7d/1701968419719/cnca_carbonneutrality_secondedition_vfinal_07_19_23_.pdf
40 C.F.R. § 98.6 (“Agricultural by-products means those parts of arable crops that are not used for the primary purpose of producing food. Agricultural by-products include, but are not limited to, oat, corn and wheat straws, bagasse, peanut shells, rice and coconut husks, soybean hulls, palm kernel cake, cottonseed and sun-flower seed cake, and pomace.”)
U.S. Department of Energy. (2023). Pathways to Commercial Liftoff: Low-Carbon Cement. https://climateprogramportal.org/wp-content/uploads/2025/02/20230921-Pathways-to-Commercial-Liftoff-Cement.pdf.
Hasanbeigi, A. & Bhadbhade, N. (2022). Emissions Impacts of Alternative Fuels Combustion in the Cement Industry. Global Efficiency Intelligence. Available at: https://www.globalefficiencyintel.com/emissions-impacts-of-alternative-fuels-combustion-in-the-cement-industry.
Naushad, M. (2017). A Review on Environmental and Health Impacts of Cement Manufacturing Emissions. International Journal of Management, IT, & Engineering, 7(8), 402-415. https://www.ijmra.us/project%20doc/2017/IJMIE_AUGUST2017/IJMIEAug17KundanGr9.pdf.
Energy Integrity Project. (2024). The Long Shadow of Oil Refinery Waste: Petroleum Coke’s Polluting Legacy. https://environmentalintegrity.org/wpcontent/uploads/2024/08/EIPReport_TheLongShadowOfOilRefineryWaste_8.2.update.pdf.
Richards, J. et al. (2008). Air Emission Data Summary for Portland Cement Pyroprocessing Operations Firing Tire-Derived Fuels. Serial No. N3050, Portland Cement Association. https://archive.epa.gov/epawaste/conserve/materials/tires/web/pdf/tdf-report08.pdf.
Clean Air Task Force. (2023). Air Pollutant Reductions from Carbon Capture Report. Available at: https://www.catf.us/resource/air-pollutant-reductions-carbon-capture/.
Clean Air Task Force. (2023). Air Pollutant Reductions from Carbon Capture Report. Available at: https://www.catf.us/resource/air-pollutant-reductions-carbon-capture/.
Gary T. Rochelle’s 2024 Paper reaches the conclusion that in the context of well-designed CCS systems installed on coal and gas-fired power plants, “Even with atmospheric reactions, air quality impacts of amine, nitrosamine, and other air toxics will probably be insignificant.” While the same conclusion could be made for well-designed CCS systems on cement plants, every cement plant installing CCS should perform site-specific engineering design and health-risk modeling to inform whether additional control or design changes are necessary to eliminate health and environmental impacts. Gary T. Rochelle. (2024). Air pollution impacts of amine scrubbing for CO₂ capture. Carbon Capture Science & Technology, 11(10019), https://doi.org/10.1016/j.ccst.2024.100192; Buist, H.E., et al. (2025). Hazard assessment of nitrosamine and nitramine by-products of amine-based CCS: Alternative approaches. Regulatory Toxicology and Pharmacology, 71(3). https://www.sciencedirect.com/science/article/abs/pii/S0273230015000082.
Hasanbeigi, A., et al. (2024). Adoption of Limestone Calcined Clay Cement and Concrete in the US Market. Global Efficiency Intelligence. Available at: https://www.globalefficiencyintel.com/adoption-of-limestone-calcined-clay-cement-and-concrete-in-the-us-market.Note: this source mischaracterizes sulfur oxides (SOX) and nitrogen oxides (NOX) as greenhouse gases.
See reference 89.
CATF reviewed emissions impacts of installing CCS on the Mojave Cement Plant, which is applicable to Pathway 1. CATF. (2023). Air Pollution Reductions From Carbon Capture. Available at: https://www.catf.us/resource/air-pollutant-reductions-carbon-capture/.
Thyssenkrupp. (n.d.). catch4climate – The way to green cement production. https://www.thyssenkrupp.com/en/stories/sustainability-and-climate-protection/ci4c-the-way-to-green-cement-production.
European Commission. (n.d.). Innovation Fund projects. https://climate.ec.europa.eu/eu-action/eu-funding-climate-action/innovation-fund/innovation-fund-projects_en.
Pioneer. (2024). Typical Project: PKU Pioneer Provides VPSA Oxygen Unit for Largest CO₂ Capture Project in China’s Cement Industry. https://www.vpsatech.com/news-information/PKUPioneer-Provides-VPSA-Oxygen-Unit-for-Largest-CO2-Capture-Project-in-China-Cement-Industry.html.
Holcim. (n.d.). AIR LIQUIDE’S CRYOCAP™ FG TECHNOLOGY WILL HELP REDUCE THE CARBON FOOTPRINT AT THE KUJAWY CEMENT PLANT. https://www.go4ecoplanet.com/en/technology.
Linde. (n.d.). Adsorption-based Carbon Capture Solution Introducing HISORP CC – The Ultimate Carbon Capture Technology Toolbox Paving the Way for a Sustainable Future!. https://www.linde-engineering.com/products-and-services/process-plants/adsorption-and-membrane-plants/hisorp-cc.; Cemex. (2024, October 22). EU backs pioneering CO₂ capture project at Cemex’s Rüdersdorf cement plant. https://www.cemex.com/w/eu-backs-pioneering-co2-capture-project-at-cemexs-rudersdorf-cement-plant.
Project LEILAC. (2021). LEILAC Roadmap 2050. https://www.leilac.com/wp-content/uploads/2022/09/LEILAC-Roadmap.pdf.
Linde. (n.d.). HITREAT™ for CO₂ Purification and Liquefaction. https://www.linde-engineering.com/products-and-services/process-plants/co2-plants/co2-purification-and-liquefaction.
Chart Industries. (2022). Case Study # 24 Cryogenic Carbon Capture (CCC) in Cement and Concrete Production. https://files.chartindustries.com/CarbonCapture.pdf.
Gastaldi et al. (2023). Clinker based on calcium looped meals from the Cleanker Project. Journal of Microscopy, 294(2), 90-104. Available at: https://doi.org/10.1111/jmi.13243.
De Lena et al. (2019). Techno-economic analysis of calcium looping processes for low CO₂ emission cement plants, International Journal of Greenhouse Gas Control, 82, 244-260. Available at: https://doi.org/10.1016/j.ijggc.2019.01.005.; Gastaldi et al. (2023). Clinker based on calcium looped meals from the Cleanker Project. Journal of Microscopy, 294(2), 90-104. Available at: https://doi.org/10.1111/jmi.13243.
Credits
CATF: Sam Bailey, Ben Grove, and Darryle Ulama
Synapse Energy Economics: Lucy Metz; Cecilia Springer, PhD; Philip Eash-Gates, PE; and Ida Weiss
This report was made possible with support from the William and Flora Hewlett Foundation. The analysis and conclusions presented here are those of the authors and/or Clean Air Task Force and do not necessarily reflect the views of the funder.
CATF would like to thank stakeholders across the California cement landscape for their time and insight that helped shape this report.

