
A data-driven look at rising U.S. electricity costs and policy solutions


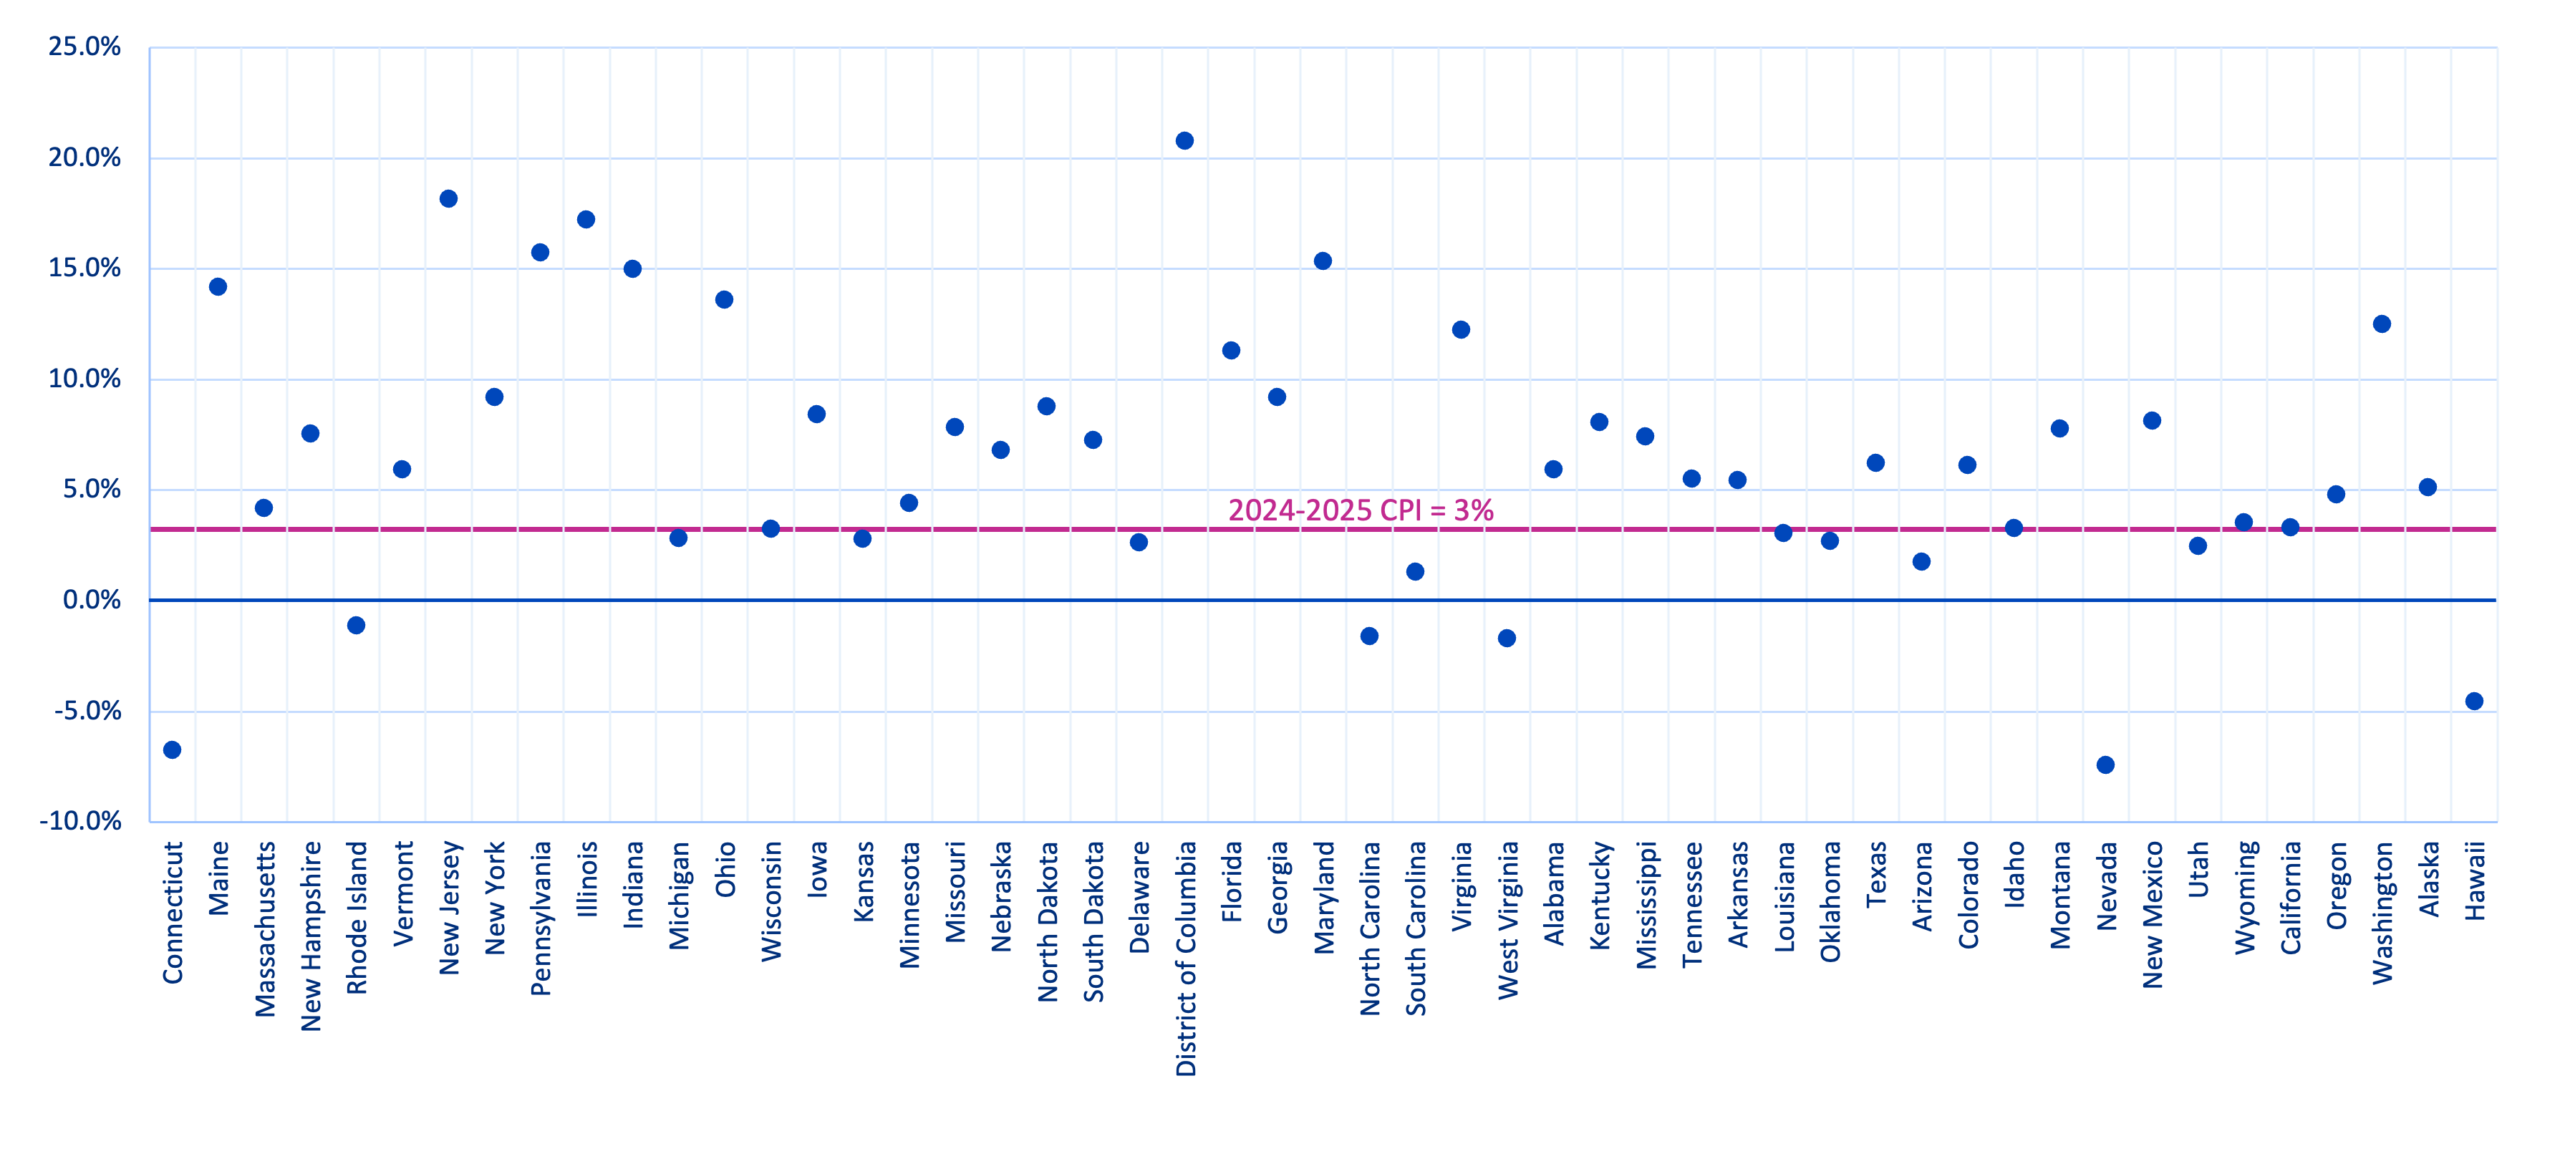
Electricity costs have become a central part of today’s energy policy conversation. Low-cost power has long underpinned U.S. economic strength, but recent data highlights a notable shift. A recent paper by researchers at Lawrence Berkeley National Laboratory (LBNL) shows that electricity prices have risen nationwide from 2019-2024. More recently, the Energy Information Agency reported that average retail electricity rates have risen by more than 5% since last year (Figure 1). State trends diverge sharply, however, as some states face above-inflation increases, while others have seen near- or below-inflation adjusted changes.
Figure 1. Data from EIA’s Electric Power Monthly dataset in September 2025. Consumer Price Index (CPI) is provided by the Bureau of Labor Statistics.
With this patchwork of complex data has come a wide array of claims about the factors impacting electricity rates, including clean energy deployment, data center growth, wholesale market dynamics, and transmission. But the reality is more complex than any one driver – it is important to appreciate that no one factor alone is responsible for electricity price changes, key drivers may be different across jurisdictions, and underlying conditions behind some of these drivers have been developing for some time.
Electricity rates reflect a complex of system, market, and policy drivers
Many factors – global and local, supply-side and demand-side, market and regulatory – influence electricity rates. Supply chain disruptions, conflicts, and other international events inject uncertainty into an interconnected global energy market, with the potential to increase costs of component parts for generation and transmission infrastructure, fuels like natural gas, and other key inputs to our domestic power sector.
The picture is further complicated by a mosaic of different regulatory and market structures across the country. In some regions, utilities plan systems and incorporate capital costs for new large infrastructure projects into their rate base. These costs vary depending on the generation, transmission, or distribution infrastructure utilities can and do build, and how costs are allocated to ratepayers depends often on state-by-state utility tariff regulations. In regions with wholesale markets, the value of different resources is impacted by market design, regional and interregional transmission planning, and interconnection queues, and varies across different jurisdictions. These varying market policies can influence which resources are built and how quickly. In all regions, a set of non-technical barriers related to siting and permitting at the state and federal levels impact the deployment of solutions.
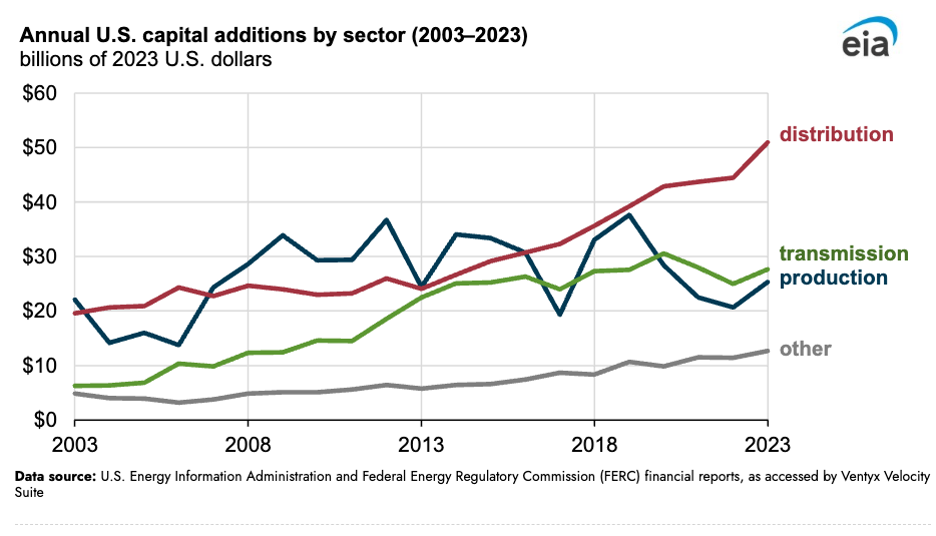
While the affordability conversation is omnipresent today, spending on grid infrastructure has been increasing for some time. Notably, distribution spending increased by 160% and transmission spending nearly tripled between 2003 and 2023 (Figure 2). Despite this, congestion remains high, indicating that the incentives and planning processes for transmission are not yielding affordable and effective results for customers. Part of this is driven by gaps as well as and planning processes that currently incentivize utilities to pre-emptively spend capital on many local projects instead of larger regional projects that may be more impactful and cost efficient. Factoring in other drivers like inflation and supply chain complications mentioned above, today’s electricity demand growth takes place in an environment of already-increasing costs, with the potential to intensify capital investment needs and exacerbate affordability challenges.
Figure 2. Electricity capital additions by segment.
A non-exhaustive overview of several key factors that can affect electricity rates:
- Infrastructure project costs: Technology costs change due to a number of reasons, such as changes to the price of raw materials and labor, advancements in manufacturing and installation, financing rates, interconnection costs, and supply chain capacities. In general, the cost of all types of generation technologies has risen significantly over the last half-decade in the U.S.
- Electricity demand: Electricity demand changes can impact electricity prices in various ways that then flow through to customer prices. For example, demand growth can increase the utilization rate of fixed infrastructure, such as distribution grids, and decrease per-unit prices for customers. However, demand growth can also result in decisions to build new infrastructure that increase the total costs spread among customers. In wholesale market regions, demand growth can increase market clearing prices, especially if new supply, storage, and demand-response is limited. In contrast, decreases in demand, such as through net-metering of behind-the-meter resources or relocation of industry, often increase the per-unit costs, especially for fixed transmission and distribution infrastructure.
- Speed of generation interconnection: Inability to connect new generation to the grid in a timely manner can put upward pressure on costs, adding stress to the system and forcing existing, often aging and uneconomic units to stay online longer to maintain reliability. In markets where utilities own and operate generation resources, new generation can be factored into the rate base and those costs can be passed on to consumers.
- Fuel prices: Natural gas prices, for example, are highly volatile, injecting uncertainty into contracts and required infrastructure, increasing costs.
- Cost of Capital: Dictated by global and national economics, events, and fiscal policy, the cost of capital directly impacts the cost of infrastructure and the return on capital from investors in projects and utilities.
- Transmission planning and costs: Historic failure to plan and build transmission infrastructure has increased congestion, which increases revenue for generation owners in high priced areas, and reduced grid reliability and resiliency. Materials costs and inflation have also increased the cost of basic system upgrades and maintenance, notwithstanding any new additions to the system.
- Distribution planning and costs: Inflation, end-of-life replacement, and other costs have inflated utility distribution networks that are planned by local retail utilities and approved by utility commissions.
- Extreme weather and wildfire mitigation: Hurricanes, storms, and wildfires –events predicted to be made worse by future climate change – can raise retail electricity prices through both short-term recovery and rebuilding, and longer-term costs such as infrastructure hardening, damages, and liability insurance coverage to protect utilities.
- Market design: Changes in market design, such as re-rating of resource capacities eligible to contribute to capacity markets, and other design choices can impact market prices.
- Rate Design: Policies regarding net-metering, cost-allocation, rate tariffs, and other retail rate design decisions can impact costs. For example, recent reports suggest that residential ratepayers are paying for large data center costs in some regions.
- Natural Gas Prices: Exposure to natural gas price risk increases electricity prices when gas prices rise. In the future, U.S. gas prices will be more directly linked to global liquefied natural gas markets as export capacity will grow substantially over the next five years, which will put upward pressure on prices (all things equal).
Examining key drivers: State cost trends, transmission, load growth, markets, clean energy, and extreme weather
While nationwide trends are clear, affordability challenges vary by state
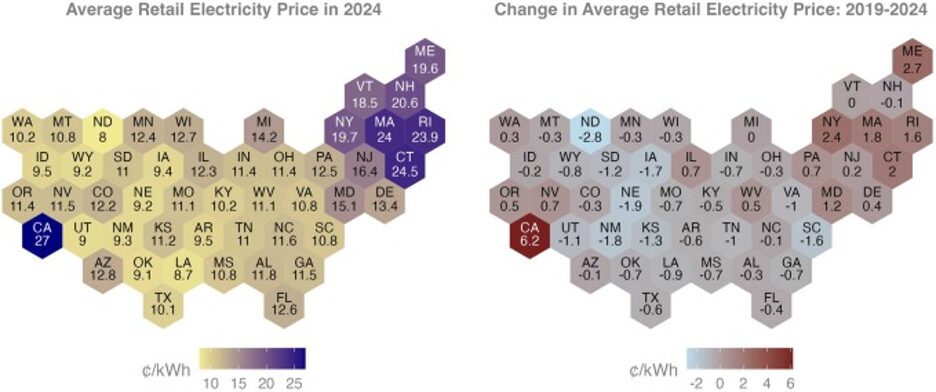
National average electricity rates have tracked inflation from 2019-2024, with electricity expenditures declining as a share of U.S. GDP. Rate increases have since accelerated to roughly 7%, significantly outpacing inflation, in the last year. But these national averages mask significant variation in state-level electricity rate impacts, with West Coast and Northeast states experiencing significant increases, and most of the rest of the country experiencing slower increases (and sometimes even decreases if adjusted for inflation).
Figure 3. Retail electricity prices in 2024 and inflation-adjusted price changes from 2019 to 2024 (in 2024 dollars).
Consider two notable regions: California and the wholesale market PJM Interconnection (PJM). In California, wildfire-related expenditures accounted for roughly two-thirds of the rate increases from 2019-2024. In 2024, wildfire-related costs made up 17% of retail rates in 2024, up from only 1.7% in 2019. Meanwhile, in the wholesale market PJM, challenges with developing and interconnecting new generating capacity, resource-derating, and load growth have resulted in capacity market prices increasing substantially in the last several years.
Despite rising investment in transmission, grid buildout remains inefficient and poorly coordinated, increasing congestion and limiting opportunities for regional transmission to lower rates
Transmission infrastructure investment has increased significantly over the past couple of decades, but spending has been driven more toward replacing existing, outdated infrastructure and less toward optimizing our national electricity system to reduce system costs. A big driver of this trend is the failure to coordinate transmission planning and deployment within and between regions. While FERC started to address planning challenges within regions through Order 1920, incredibly few efforts exist for interregional development.
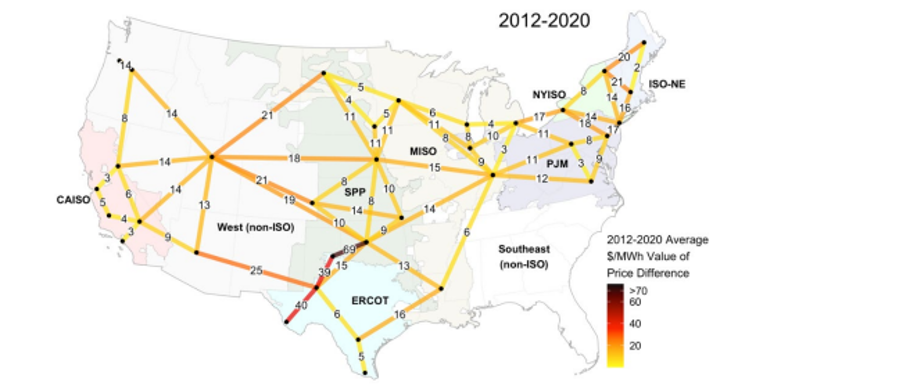
This failure to plan and invest in interregional infrastructure creates congestion in the system. Congestion limits power flows between regions that prevent low-cost electricity from being transmitted to areas with higher electricity costs, creating suboptimal grid conditions and squeezing consumers in congested areas. The Department of Energy National Transmission Needs Study found that between 2011 and 2020, development of large regional and interregional lines that have significant cost reduction potential (Figure 4) declined while a piecemeal set of smaller and less efficient utility-developed transmission constituted most buildout. Failure to invest in infrastructure that can connect regions and concentrating investment where those investments can earn a rate of return for a utility will continue to drive up both overall system costs and rates.
Figure 4. Map of mean marginal transmission market values for all 70 analyzed links over the entire study period (2012-2020).
Load growth can improve grid utilization, or drive costs up, depending on planning
Today, an additional dynamic is load growth. New loads can exert downward rate pressure if they can better utilize existing transmission and distribution infrastructure, which can be aided by load flexibility. Similarly, reductions in load can increase rates without adequate rate tariffs. The LBNL study found that states with behind-the-meter solar tariffs are correlated with higher rates, reflecting upward pressure caused by load reductions without proper cost allocation.
However, new large loads, particularly load driven by one customer or a small set of large customers (such as data centers), can trigger the need to build new infrastructure, increasing the costs that utilities need to recover and driving up rates for all ratepayers in a jurisdiction. Careful consideration is necessary to ensure that average ratepayers are not unfairly paying for specific commercial developments, and that tariffs allocate costs fairly to their respective loads.
Market design choices, interconnection queues, and load growth have all contributed to skyrocketing capacity market prices
New load can also increase wholesale market electricity prices (and even natural gas prices via increased gas demand for electricity), especially if new generation buildout is constrained. The PJM Interconnection, the largest wholesale market in the U.S., has experienced a significant increase in capacity prices due to large load growth, sluggish interconnection queues, and an update to resource capacity rating methods that lowered the amount of energy that most generators could sell at auction. Combined, these have resulted in a near order of magnitude increase in capacity prices, which translate to retail price jumps over 15%. Despite these price increases, investors remain hesitant to build new capacity due to slow interconnection queues, constrained supply chains, uncertainty regarding future load growth, lack of new regional transmission to enable new generation, and a constantly changing regulatory landscape (e.g., the unexpected creation of the Reliability Resource Initiative).
Increasing rate trends reflect many factors — but clean energy isn’t one of them
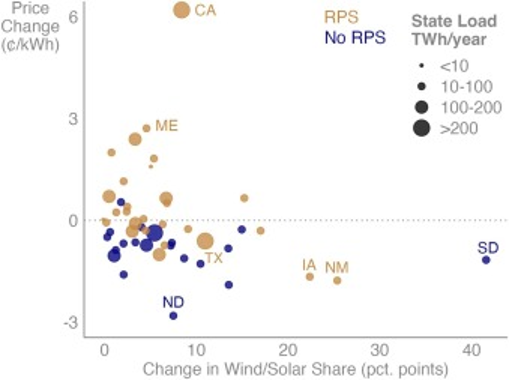
If anything is clear at this stage it is that clean electricity generation is not the culprit of cost increases. While the LBNL study notes that the combination of high renewable portfolio standards and costly or low renewable energy supplies in a few select states has the potential to increase rates, the study’s data also shows that historical deployment of clean energy technologies has no correlation with costs. For example, the states with the highest increase in renewable generation share from 2019-2024, such as Iowa, New Mexico, and South Dakota, have seen some of the largest decreases in electricity rates (Figure 5).
Figure 5. Retail electricity price changes (inflation-adjusted, in 2024 dollars) and changes in wind and solar energy share from 2019-2024.
Federal administration’s tariffs, orders, and actions are increasing costs
Recent administration actions, including import tariffs, orders forcing coal plants to remain online, and actions to delay or stop construction of economic projects, are increasing project costs, forcing ratepayers to pay extra to keep plants online, and preventing new power supply from being built that would lower prices. These actions not only impact the near-term composition and costliness of our energy system but also raise investor risks regarding project delays and cancellations. This elevated risk requires investors to seek higher return premiums for long-term and large-scale infrastructure projects, further increasing upward pressure on costs.
Natural gas dependent regions are at risk of fuel cost increases
States most dependent on natural gas are highly exposed to global fuel price impacts. Natural gas prices recently experienced dramatic swings: increasing sharply in 2022 following the onset of the Ukraine-Russia war and subsequently falling steeply through 2024. Data show that states with the highest share of natural gas generation saw some of the greatest increases in retail electricity prices through 2022–2023, followed by some of the largest price decreases. Moreover, recent data center demand growth is leading to a substantial buildout in new gas plants while increases in LNG export capacity will further link domestic prices to higher global prices, both of which will push up gas prices (all things equal).
Extreme weather is driving substantial rate increases in the Western United States
Wildfire damages and the expense of wildfire mitigation strategies (power line undergrounding, vegetation management, etc.) have substantially increased costs in western states. Nowhere is the impact more apparent than in California, where wildfire-related costs constituted an average of 17% of total investor owned utility revenue requirements — up from 1.7 % in 2019. But impacts are not limited to California or to the West, with Florida, Maine, Oregon, and others showing significant extreme weather impacts. Unfortunately, more areas are increasingly at risk as climate change becomes more severe.
Solutions for managing electricity rates
Fortunately, many solutions to manage electricity rates and emissions exist. However, no one solution is sufficient and each will require tailored policy reforms for specific jurisdictions and levels of government. This reality shouldn’t dissuade action – near-term reforms have outsized long-term impacts, and more substantive reforms and planning can facilitate sustainable management of both load increases and affordability going forward. However, the multifaceted approach required means policymakers must build upon a data-driven foundation to separate solutions that produce durable cost reductions from rhetoric that doesn’t help everyday Americans and businesses. Some solutions will take time to register in prices while others will have positive but limited impacts.
Last year, CATF commissioned a report by The Brattle Group that characterized many commercially available, cost-effective solutions that can be deployed quickly to increase the utilization of the existing grid, accelerate the connection of new loads and resources, and improve planning and procurement practices. New strategies for managing data center load growth are also emerging, but implementation remains largely nascent. Below, we outline a range of solutions and an illustrative indication of the potential timing of results. The measures identified can minimize costs and emissions, maintain electricity reliability, and ensure energy infrastructure keeps pace with surging demand and changing public policy goals. In addition to identifying policy changes, the report identifies the policymakers and regulators responsible for enabling change.
CATF has a track record of research on several of the measures included in this report, including public financing, interconnection practices, transmission planning and deployment, and new technology commercialization, as well as organization-wide focus on siting, permitting, planning, and community engagement practices across a wide suite of technologies that lower individual project and systemwide costs and alleviate ratepayer burdens.

While reversing recent trends in electricity prices will not be easy, requiring a collective set of proactive actions from all regions and levels of government provides the necessary foundation for long-term success.

