
The State Industrial Policy Playbook – A Policy Guide for Low-Emission Heavy Industry

Executive Summary
The industrial sector is a cornerstone of the U.S. economy, employing over 12 million workers and generating $851 billion in annual payroll, but it is also responsible for approximately 12 percent of harmful air pollutants and 23 percent of greenhouse gas (GHG) emissions. While decades of deindustrialization have eroded economic vitality in many regions, strategic investments in low-emission industrial technologies offer an opportunity to invigorate communities, secure high-quality jobs, and strengthen national security by reducing reliance on volatile foreign energy and materials markets.
Key Industrial Subsectors
This report focuses on four high-emitting subsectors which account for about 40 percent of U.S. industrial emissions:
Petroleum Refining
Essential for transportation fuels and chemical feedstocks. Petroleum refining emits carbon dioxide (CO2) primarily from fossil fuel combustion for high-temperature, continuous operations such as distillation, cracking, and reforming. Additional emissions come from hydrogen production, flaring, and venting. Decarbonization requires electrification, low-carbon hydrogen, carbon capture, utilization, and storage (CCUS), and a transition to alternative fuels and feedstocks.
Chemical Manufacturing
Produces key inputs for plastics, fertilizers, and fuels. Major emissions sources are combustion of fossil fuels for process heat, especially in steam crackers, and the use of fossil-based feedstocks, which release CO2 during chemical transformations. Electrification, low-carbon hydrogen, and CCUS are key solutions for reducing emissions.
Cement Manufacturing
Vital for construction. Cement manufacturing emits large amounts of CO2 from two main sources: fossil fuel combustion for kiln heat and the calcination process, in which limestone releases CO2 when it chemically converts to lime. Clean cement offers public health and emissions benefits, achievable through efficiency, CCUS, and alternative production processes.
Iron and Steel Manufacturing
Foundational for infrastructure and vehicles. The traditional blast furnace-basic oxygen furnace (BF-BOF) production method emits CO2 from both coal combustion for heat and as a chemical reducing agent for iron ore. The United States leads in low-emissions electric arc furnace (EAF) steel, but deeper decarbonization requires more scrap recycling, further electrification, hydrogen-based direct reduction, and CCUS.
Technology Pathways
Deep decarbonization of heavy industry requires a portfolio approach that combines mature and emerging technologies:
Electrification
The replacement of emissions-intensive heat and energy sources with electric technologies, ideally powered by affordable, zero- and low-emission electricity. Commercially ready for some processes (e.g., EAFs in steel) and emerging for others. High-temperature heat electrification in cement and chemicals is advancing through pilots.
Carbon Capture, Utilization, and Storage (CCUS)
The capture of carbon emissions with two possible end uses: permanent sequestration, where captured CO2 is stored deep underground in geological formations; or utilization, where CO2 is used as an input in other products or industrial processes. Critical for sectors with process emissions. The United States leads in installed capacity but needs expanded infrastructure and state incentives.
Alternative Production Processes
Fundamentally new methods of manufacturing industrial materials that break from traditional fossil-fuel-based, high-emitting pathways. Innovations such as hydrogen-based direct reduced iron (H2-DRI) and electrochemical cement can achieve near-zero emissions but require substantial investment.
Feedstock Substitution
Replacing conventional raw materials (often fossil-based or emissions-intensive) with lower-carbon, recycled, or bio-based alternatives.Use of recycled scrap, bio-based chemicals, and supplementary cementitious materials can yield immediate emissions cuts.
Alternative Fuels
Energy sources used to replace conventional fossil fuels that, depending upon the life-cycle analysis of emissions, can lower the carbon intensity of generating industrial heat. Biomass, waste-derived fuels, and low-carbon hydrogen can substitute for fossil fuels in high-heat applications, serving as a transitional pathway.
Energy and Materials Efficiency
A range of strategies aimed at reducing the energy and resource intensity of industrial production. Upgrades and process optimization can deliver immediate, cost-effective emission reductions of 10–20 percent in many facilities.
Policy Landscape
Federal Policy Context: Landmark federal investments, such as the Infrastructure Investment and Jobs Act (IIJA) and Inflation Reduction Act (IRA), have catalyzed $142 billion in low-emission energy and industry projects, leveraging tax credits, grants, and procurement standards. However, some funding has been rescinded, and future funding is uncertain, making federal-state policy alignment and state leadership crucial for durable progress.
State Policy Trends: Across the political spectrum, states are advancing low-emission industrial policies driven by shared goals, such as economic growth, job creation, emissions reduction, improving public health, and competitiveness. A diverse range of state-level policies is emerging to meet these objectives, offering practical examples and insights that other states can adapt and replicate to suit their own industrial contexts.
State Policy Toolkit
States have a diverse and expanding toolkit to accelerate low-emission industrial policies; some key measures are outlined below:
- Financial Incentives: Tax credits, grants, and public-private partnerships to close the cost gap for low-emission industry, especially when stacked with federal incentives.
- Targeted Research, Development, and Demonstration (RD&D) Support: Funding for emerging technologies and pilot projects to accelerate commercialization and build in-state expertise.
- Technical Assistance and Workforce Training: State agency- and university-provided roadmaps, technical support, and training to ensure programs reach both large and small enterprises.
- Market-Shaping Demand Policies: State procurement standards, advanced market commitments, and multi-state procurement models to create reliable demand for low-carbon products and de-risk private investment.
- Environmental Product Declarations (EPDs) and Labeling: Increased transparency and enable preferential procurement of low-emission products.
- Contracts for Difference (CfDs) and Preferential Bidding: Mechanisms to provide price stability and reward contractors using low-emission materials.
- Streamlined Siting and Permitting: Centralized processes and shared infrastructure anchors (e.g., port authorities, industrial hubs) reduce project delays and attract investment.
- Strengthened Regulations: Enhanced air quality standards, GHG caps, and extended producer responsibility (EPR) for plastics and chemicals.
Case Studies
This report highlights policy examples from multiple states and features three in-depth case studies of leading states in low-emission industrial innovation:
- Missouri Cement Decarbonization: Targets cement decarbonization through developing a statewide plan to maximize federal funds for clean heat, alternative fuels, and efficiency upgrades, prioritizing near-term emissions cuts and job retention
- Louisiana Carbon Capture Utilization and Storage: Streamlined CCUS laws and regulatory primacy have enabled $23 billion in announced investments and 4,500 expected jobs, but ongoing efforts will be needed to strengthen implementation and build community confidence.
- Colorado Industrial Policies Portfolio: Mandates a 20 percent reduction in industrial GHG emissions by 2030, with refundable tax credits, a Carbon Management Roadmap, and technical assistance, resulting in $1.7 billion in project announcements and 4,900 new jobs from 2022–2024.
Conclusion
States are at the forefront of industrial innovation and uniquely positioned to align federal investment with tailored state action that drives job creation, attracts private investment, and achieves environmental and public health goals. This report offers support for states in developing nuanced low-emission industry strategies tailored to their specific industrial mix, drawing on a combination of near- and long-term policy levers. By deploying financial incentives, demand-side policies, and regulatory standards, states can maximize both economic and environmental returns. These strategies are strengthened by integrated, cross-sector actions, including robust data and monitoring, compliance and accountability, and meaningful stakeholder engagement.
SECTION 1
Industrial Landscape
The Industrial Profile
The industrial base is a cornerstone of the U.S. economy. It employs over 12 million workers across nearly 300,000 facilities and generates an annual payroll of $851 billion as of 2022.1 Industrial facilities often serve as economic anchors for surrounding communities, providing not only direct employment but also stimulating local economies through upstream and downstream supply chains. Regional ecosystems of logistics, engineering, and maintenance services provide support to industrial clusters, such as the Port of Houston or the Gulf Coast refining corridor.
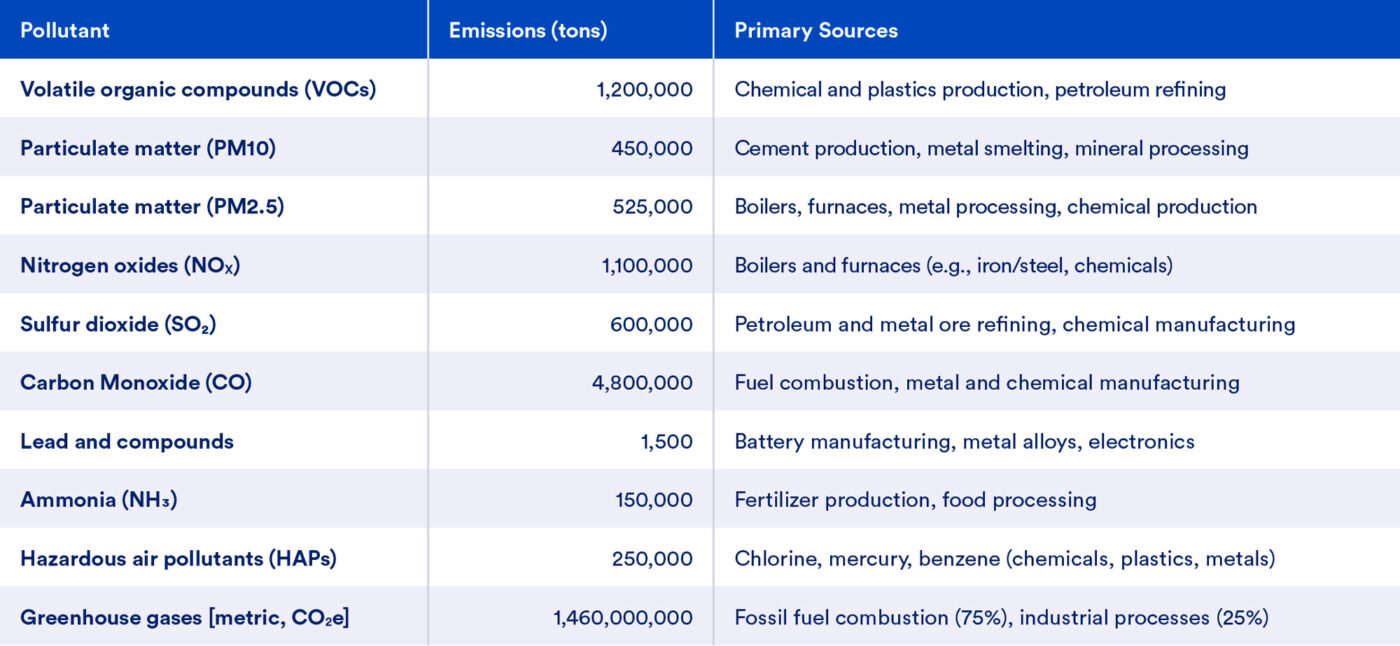
In addition to its economic importance, U.S. industry is a major contributor to air pollution (Table 1). The U.S. industrial sector consists of an array of diverse industries with distinct processes, technologies, and emissions profiles. In 2022, U.S. industrial operations were responsible for approximately 8.8 million tons of criteria air pollutants (including ozone precursors) which is about 12 percent of the U.S. total. Additionally, the sector emitted 1,460 million metric tons (MMT) of carbon dioxide-equivalent emissions (CO2e), or about 23 percent of total U.S. greenhouse gas emissions. When accounting for indirect emissions from electricity use, this share increases to around 30 percent. The sector also consumed 26.7 quadrillion BTU of energy in 2022, making it one of the most energy-intensive parts of the economy. The majority of this was from manufacturing industries (76 percent), followed by mining (12 percent), construction (7 percent), and agriculture (4 percent).2
Unlike the power or transportation sectors, where emissions have declined due to concerted policy and technological progress, industrial emissions have remained steady over the past two decades despite gains in efficiency.3 This challenge results from the inherent complexity of modernizing industrial operations, which often require sustained high-temperature heat, generate process emissions that cannot be abated through fuel- switching alone, and depend on fossil-derived feedstocks in key subsectors such as chemicals, steel, and plastics. Further, effective policy frameworks must be tailored to regional industrial landscapes and recognize the diversity of technological readiness and emissions profiles across subsectors. Lastly, industrial processes vary significantly and require tailored strategies to reduce emissions. Cement, iron and steel, chemicals, and petroleum refining—the four highest emitting industries in the United States4—have very different processes but share similarities, such that each offers distinct challenges to reducing emissions.
Nevertheless, momentum is building for modern and low-emission industrial processes, led by both public investment and private sector innovation.
Table 1: Estimated annual air pollution from U.S. manufacturing (NAICS 31-33), 2022
Sources:
U.S. EPA. 2024. National Emissions Inventory (NEI). Available at: https://www.epa.gov/air-emissions-inventories.
U.S. EPA. 2023. “Toxics Release Inventory (TRI) Program.” Available at: https://www.epa.gov/toxics-release-inventory-tri-program.
Shapiro, J.S. and Walker, R. 2018. “Why is pollution from US manufacturing declining? The roles of environmental regulation, productivity, and trade,” American Economic Review, 108(12), pp. 3814–3854.
National Association of Manufacturers. 2023. U.S. Air Quality Standards and the Manufacturing Sector. Available at: https://documents.nam.org/COMM/NAM_Air_Quality_Standards_Analysis_Web_Version.pdf.
U.S. EPA. 2024. Inventory of U.S. Greenhouse Gas Emissions and Sinks: 1990–2022.
Available at: https://www.epa.gov/ghgemissions/inventory-us-greenhouse-gas-emissions-and-sinks.
Congressional Budget Office. (2024). “Emissions of Greenhouse Gases in the Manufacturing Sector.” Available at: https://www.cbo.gov/publication/59695.
Benefits of Low-Emission Industry
Low-emission industry refers to industrial activities that minimize environmental harm by lowering greenhouse gas emissions and air pollutants associated with a given product end-use category.5 Low-emission industry not only provides emissions reduction and associated health benefits but also supports economic independence and competitiveness for U.S. industries in domestic and global markets that value low-emission products.
Strategic investments in low-emission industrial technologies have the potential to invigorate American industry, particularly in communities that have experienced decades of decline due to deindustrialization. Since 1979, domestic manufacturing employment has decreased from 22 percent of total (non-farm) U.S. employment to just 8 percent as of March 2025.6 This steep reduction in industrial jobs has contributed to the economic stagnation of former manufacturing hubs.7 Low-emission industry can reverse these trends by offering new types of industry, such as manufacturing
facilities for batteries or electrolytic hydrogen production facilities, which offer new opportunities for high-quality, stable jobs in regions that have historically depended on industry. Further, modernizing existing industrial facilities can provide sustained, long-term opportunities for workforce development.
Upgrading or building new low-emission industrial facilities can also substantially enhance a state’s fiscal health. Such projects grow the local tax base, contribute to property and payroll taxes, and often lead to additional private investment. Further, global and domestic industrial competitiveness increasingly depends on low- emission products, which offer a competitive advantage and premium prices to U.S. industries if they utilize clean technologies. As global and domestic buyers demand low-emission products, states with forward-thinking industrial policy will be best positioned to retain and attract advanced manufacturing operations.
Low-emission industry also has strategic national importance. Reducing dependence on foreign fossil fuel supplies and imported materials enhances U.S. energy and materials security while reducing exposure to volatile global market prices. Industries such as steel and cement play essential roles in defense, infrastructure, and energy system resilience. This makes their emissions reduction not just an environmental imperative but a matter of national security. Targeted state and federal support are critical to help industries modernize and reduce pollution. Recent federal investments have driven major progress in low-emission industry and competitiveness. However, near-term political uncertainty threatens to delay capital investments, making state-level action discussed in this report even more important to ensure stability and maintain momentum.
Pillars of U.S. Industry
Though industrial activity spans many sectors and influences emissions reduction across the economy, this report focuses on four key industries, referred to as industrial subsectors—chemicals, refineries, cement, and iron and steel—due to their outsized contributions to both economic output and greenhouse gas emissions. These industries are foundational to the U.S. economy, as they employ approximately 340,000 workers and serve as essential inputs to a wide range of downstream sectors.8 Together, they account for approximately 40 percent of total U.S. industrial emissions, making them critical to any serious emissions reduction effort.9 Beyond their emissions profiles, their technological and operational characteristics also present overlapping challenges, including reliance on high-temperature processes, substantial process emissions, and intricate supply chains—often concentrated within large, integrated industrial complexes. Moreover, these subsectors tend to have limited viable product substitutes, are frequently exposed to international trade pressures, and are often situated in politically and economically strategic regions. These factors make them both high-impact and politically salient targets for tailored, state-level low-emission industry policies.
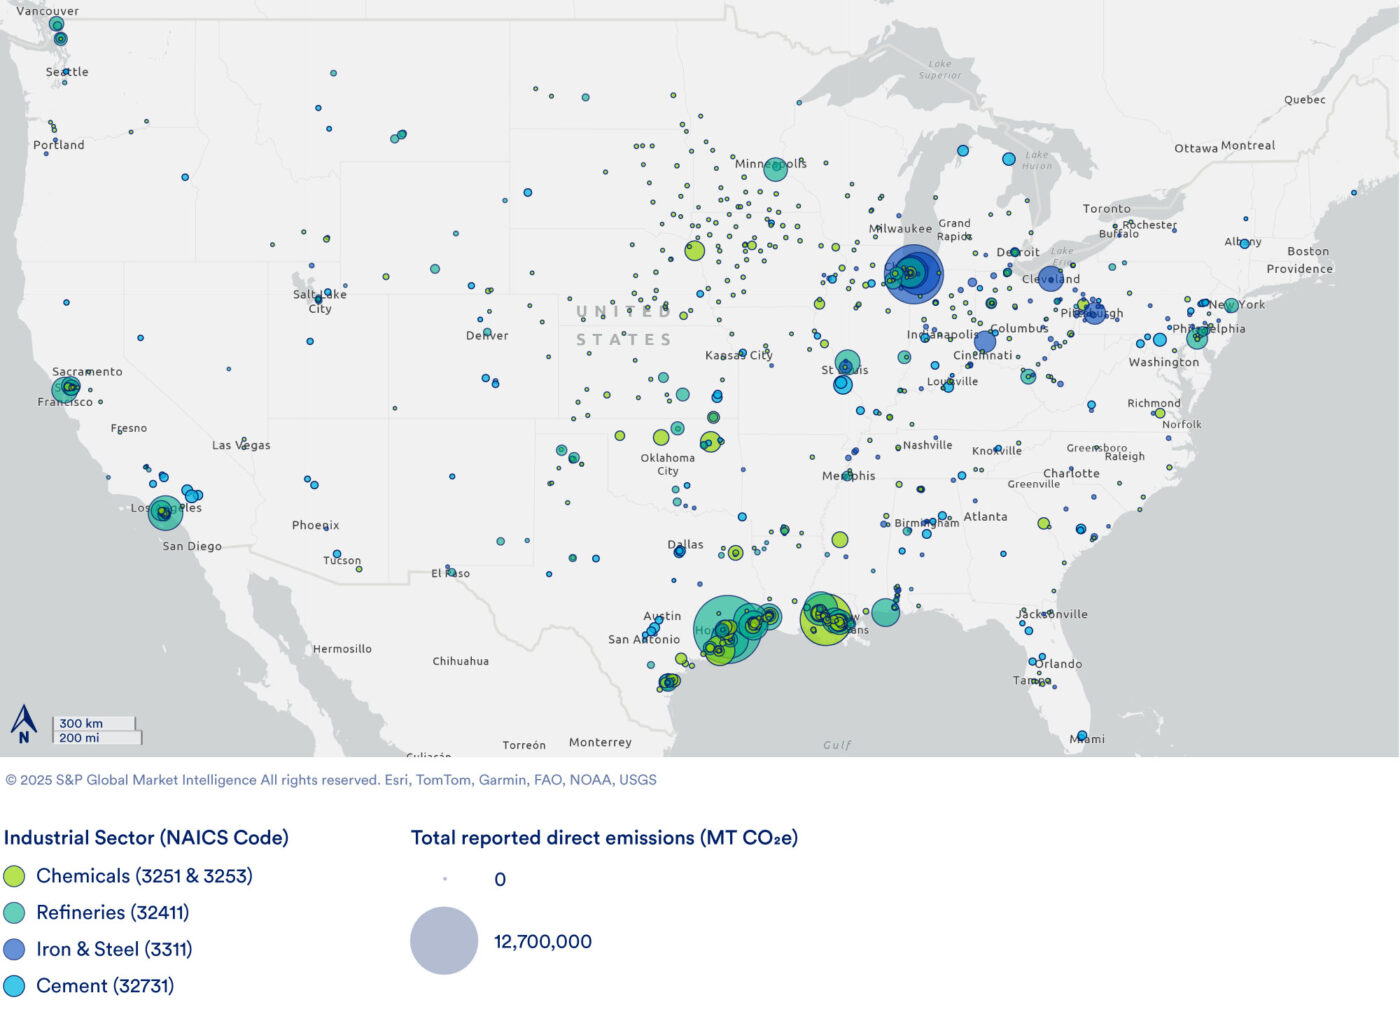
This section provides a high-level description of the industrial processes constituting each subsector and describes the major products, types of facilities, and types of industrial equipment for each. The scope of each subsector is classified according to their designation within the North American Industry Classification System, or NAICS.10 Table 2 summarizes key economic and environmental data for each of the four subsectors, including the number of employees, annual payroll, total number of high-emitting facilities, and annual greenhouse gas emissions. Figure 1 illustrates the distribution of facilities across the United States, categorized by industry sector. The size of each marker signifies the magnitude of direct greenhouse gas emissions.
Table 2: Summary of economic (2022) and emission data for subsectors of interest (2023)
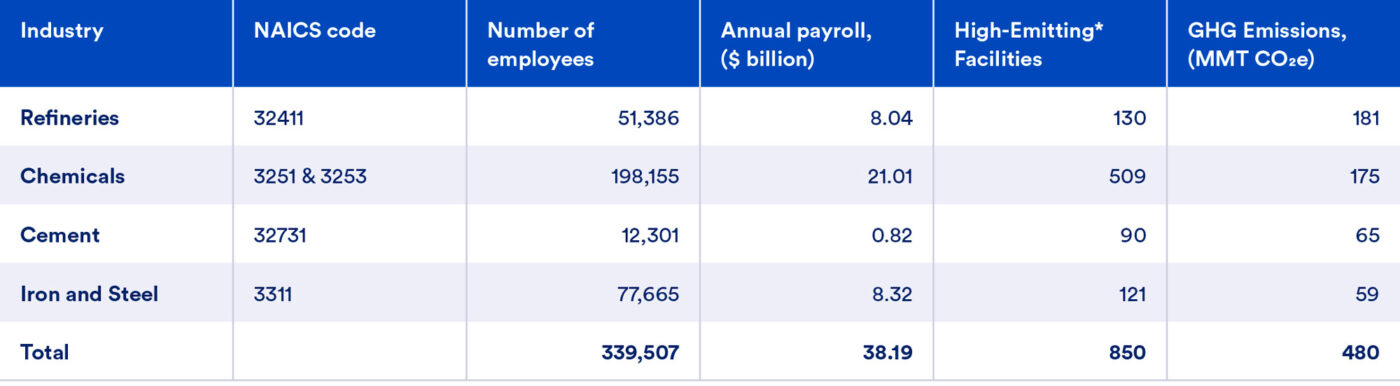
Sources: U.S. Environmental Protection Agency, Facility Level Information on GreenHouse gases Tool (Available at https://ghgdata.epa.gov/ ghgp/main.do?site_preference=normal); U.S. Census Bureau, County Business Patterns, 2022 (Available at https://www.census.gov/programs- surveys/cbp/data/tables.html).
Figure 1: Chemicals, refining, cement, and iron & steel facilities direct emissions (MT CO2e)
Petroleum Refining
The petroleum refining industry11 processes crude oil into many products including petrochemical feedstocks and essential fuels such as gasoline, diesel, jet fuel, and biofuels that are crucial for transportation and commerce. Refining involves heating crude oil in distillation columns to separate it into various fractions based on their boiling points. Subsequently, processes like cracking and reforming transform heavier fractions into lighter, more valuable fuels. Reforming processes rearrange molecular structures to improve fuel quality, while hydrocracking uses hydrogen under controlled pressures and temperatures to break down large hydrocarbon molecules into smaller, more valuable molecules. Key units include steam methane reformers (SMRs), fluidized catalytic crackers (FCC), catalytic reformers, and hydrocrackers.Petroleum refining supports the U.S. economy by providing essential fuels fundamental to trade, transportation, and overall economic activity. Refineries employ approximately 51,000 workers nationwide, stimulate broader economic activities, and are critical to economic and energy security.12 According to the U.S. Bureau of Labor Statistics’ National Employment Projections, nationwide employment in the petroleum and coal products manufacturing industry is expected to decrease by three percent between 2023 and 2033.13 Texas, Louisiana, California, Illinois, and Washington are the top five states with the highest emissions from the refining sector. Together, these states account for 71.5 percent of the 181 million metric tons of carbon dioxide equivalent (MMT CO2e) emitted by refineries in 2023. Emissions from on-site hydrogen production at refineries are included within the refining sector totals.
Table 3 shows the top five states and emissions quantities. For the purposes of this analysis, petrochemicals are considered distinct from refinery products; they are included as part of the chemical manufacturing industry since they are often produced on the site of a chemical plant using standard chemical manufacturing processes.14
Table 3: Top five states with highest direct GHG emissions from the refining sector (NAICS 32411) (Metric Tons CO2e)

Chemical Manufacturing
The chemical manufacturing industry15 produces essential chemical building blocks used in numerous products, including plastics, fertilizers, and synthetic materials. Primary products include the following:
- Petrochemicals such as plastic precursors (ethylene and propylene) and cyclic aromatics like benzene, toluene, and xylene (BTX)
- Industrial gases including hydrogen
- Fertilizers including ammonia and urea
- Chlor-alkali chemicals
- Ethanol
- Other organic and inorganic chemicals
Facilities typically use large reactors and energy-intensive processing equipment, including distillation columns, steam methane reformers (SMRs), steam crackers, and electrolyzers. Chemical manufacturing typically involves converting raw materials such as natural gas, petroleum, and minerals to a variety of products through chemical reactions and separations under controlled temperature and pressure conditions. For example, steam methane reformers produce hydrogen from natural gas; steam crackers transform hydrocarbons into petrochemicals such as ethylene; and electrolyzers split molecules such as sodium chloride into chlorine and sodium hydroxide. This subsector is vital to the U.S. economy, supporting industries such as agriculture, automotive, construction, pharmaceuticals, and consumer products. It also employs a substantial workforce—approximately 198,000 jobs—and significantly contributes to U.S. exports.16,17 According to the U.S. Bureau of Labor Statistics’ National Employment Projections, nationwide employment in the chemical manufacturing industry is expected to increase by 2.7 percent between 2023 and 2033.18 Texas, Louisiana, Iowa, Oklahoma, and California are the top five states with the highest emissions from the chemicals sector. Together, these states account for 73.8% of the 175 MMT CO2e emitted by chemical manufacturing facilities in 2023. Table 4 shows the top five states and emissions quantities.
Table 4: Top five states with highest direct GHG emissions from the chemicals sector (NAICS 3251 & 3253) (Metric Tons CO2e)

Cement Manufacturing
The cement manufacturing industry19 produces Ordinary Portland Cement (OPC), masonry cement, and other hydraulic cements. Cement acts as the critical binding agent in concrete and is essential to construction projects such as roads, bridges, and buildings. The production process involves crushing limestone and minerals, heating them in pre-calciners and rotary kilns to form clinker, and grinding the clinker into cement powder.
In cement manufacturing, crushed limestone and other minerals are heated in rotating kilns at high temperatures (approximately 1450°C) to produce clinker—a precursor to cement. During this calcination process, limestone emits carbon dioxide as it decomposes. The resulting clinker is cooled, ground, and mixed with additives such as gypsum to produce cement.
Concrete is the most widely used building material globally. Cement manufacturing employs approximately 12,000 workers nationwide, underpinning a large construction industry critical to both state and national economies.20,21 According to the U.S. Bureau of Labor Statistics’ National Employment Projections, nationwide employment in the nonmetallic mineral manufacturing industry as a whole is expected to increase by 2.5 percent between 2023 and 2033.22 Texas, California, Missouri, Florida, and Alabama are the top five states with the highest emissions from the cement sector. Together, these states account for 45.1% of the 65 MMT CO2e emitted by cement manufacturing facilities in 2023. Table 5 shows the top five states and emissions quantities.
Table 5: Top five states with highest direct GHG emissions from the cement sector (NAICS 32731) (Metric Tons CO2e)

Iron and Steel Manufacturing
The iron and steel manufacturing industry23 produces essential materials fundamental to construction, infrastructure, transportation, and manufacturing.
Steel is primarily made through two methods:
- Blast Furnace-Basic Oxygen Furnace (BF-BOF): Converts iron ore into steel using coke as a fuel and reductant. Although energy-intensive, it produces high-quality steel, including for automotive and infrastructure use.
- Electric Arc Furnace (EAF): Primarily melts recycled steel scrap using electricity.
Steel production via BF-BOF begins by converting iron ore into molten iron using coal-derived coke in blast furnaces. This molten iron is then refined into steel using oxygen in basic oxygen furnaces. In contrast, EAF steelmaking involves melting scrap metal with electric arcs, substantially reducing emissions and energy use compared to traditional methods.
Major products include flat steel (coils, plates), long steel (pipes, beams), and ferroalloys (such as ferromanganese, ferrochromium, and ferrosilicon). Key equipment comprises BF-BOFs, EAFs, direct reduced iron (DRI) furnaces, and rolling and casting equipment. The steel sector is essential for domestic infrastructure projects, automotive manufacturing, and national security with approximately 78,000 employees.24,25 According to the U.S. Bureau of Labor Statistics’ National Employment Projections, nationwide employment in the iron, steel, and ferroalloy manufacturing industry as a whole is expected to increase by 3 percent between 2023 and 2033.26
Indiana, Ohio, Pennsylvania, Alabama, and Illinois are the top five states with the highest emissions from the cement sector. Together, these states account for 80.8% of the 59 MMT CO2e emitted by iron, steel, and ferroalloy manufacturing facilities in 2023. Table 6 shows the top five states and emissions quantities.
Together, these four subsectors are vital to the U.S. economy. They are major employers, provide essential products for everyday life, and are integral to countless other industries. Technological innovation and state policies are creating effective pathways to reduce emissions from these industries while maintaining economic competitiveness.
Table 6: Top five states with highest direct GHG emissions from the iron and steel sector (NAICS 3311) (Metric Tons CO2e)

SECTION 2
Technology Pathways
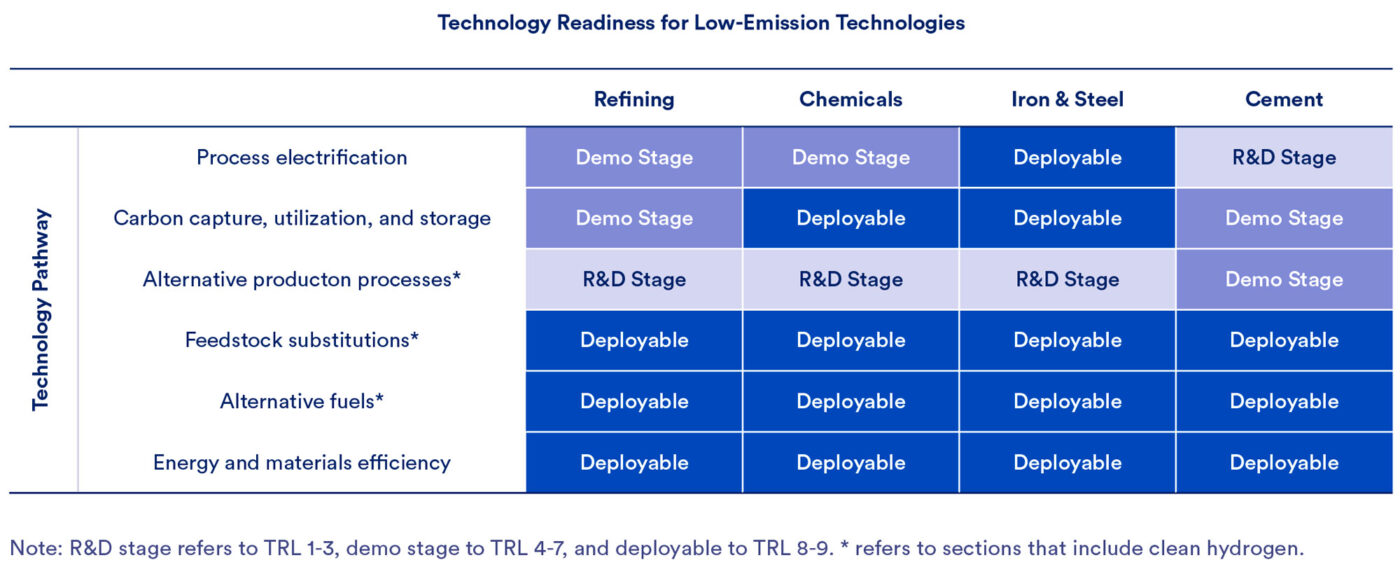
Technological innovation helps to ensure industry remains competitive in a low-emission economy. This section explains the leading technology pathways, their current development status, and their relevance within each of the four subsectors considered in this report. The development status of a particular technology is indicated by its Technology Readiness Level (TRL), which provides a standardized scale from 1 to 9 to assess its market maturity, where TRL 1 indicates basic research and TRL 9 reflects a technology fully proven and operational in commercial applications.27
While TRLs are a useful measure of technical maturity, they may not account for critical real-world deployment factors such as input supply, infrastructure readiness, or market conditions. As such, policies must address not only technical scaling but also the economic, logistical, and regulatory barriers that shape the pace and success of low-emission technology deployment. Table 7 summarizes clean technology pathways and their readiness for heavy industry. For subsector-specific details on each technology pathway, refer to Appendix B: Clean Technology Pathways – Subsector Detail.
Table 7: Technology pathways for low-emission industry, with subsector mapping
Process Electrification
Process electrification refers to the replacement of emissions intensive heat and energy sources with electric technologies, ideally powered by affordable, zero- and low-emission electricity. This strategy is central to low-emission industry because it enables emissions reductions across sectors without fundamentally altering end products. In many cases, it can also dramatically reduce or eliminate other non-greenhouse gas air pollutants associated with combustion of fuels and feedstocks, thereby improving health outcomes in surrounding communities. The pace of reducing emissions in the electricity sector and current access to zero- and low-emission electricity varies widely across regions due to differences in state policies, resource availability, and infrastructure constraints; nonetheless, in many grid regions today (and more in a future, higher renewables electric grid), process electrification will result in substantial GHG emission reductions.28
While electrification can offer substantial emissions abatement (particularly when coupled with zero- and low-emission electricity), it faces practical challenges in many industrial settings, including high-temperature requirements, retrofitting costs, and increased electricity demand. Electrification technologies range from mature solutions, such as Electric Arc Furnaces (EAF) in steelmaking, to early-stage innovations such as electric kilns for cement and electric steam crackers for chemicals. Industrial heat pumps are commercially mature (TRL 9) and highly effective for heating applications typically below 200°C but are generally not suitable for the high-temperature demands of heavy industry.29 Most heat requirements in sectors such as cement, steel, chemicals, and refining exceed this threshold, necessitating the application of existing technologies such as resistive, induction, plasma, or microwave heating within the industrial sector.
While TRLs for electrification vary widely by application, with decreasing emissions intensity of the electrical grid and supportive infrastructure investment, electrification represents a transformative pathway for industrial emissions reduction.30
Carbon Capture, Utilization, and Storage
Carbon capture, utilization, and storage (CCUS) refers to the capture of carbon emissions with two possible end uses: permanent sequestration, where captured CO₂ is stored deep underground in geological formations; or utilization, where CO₂ is used as an input in other products or industrial processes. This report uses the acronym CCUS to refer generally to both types of carbon capture projects. CCUS is a critical tool for industrial emissions reduction, especially in sectors with unavoidable process emissions or limited alternatives for fuel-switching. While not a one-size-fits-all solution, CCUS can enable continued operation of existing facilities while substantially lowering their emissions footprint.
There are three main types of CCUS technologies:31,32,33
- Pre-combustion capture removes CO₂ before fuel is burned, typically through a process that gasifies fuel to produce hydrogen and CO₂, such as in hydrogen and ammonia production.
- Post-combustion capture scrubs CO₂ from flue gases after combustion and is widely deployable as a retrofit solution across many industrial sectors.
- Oxy-combustion burns fuel in pure oxygen, resulting in a more concentrated CO₂ stream that simplifies capture but requires more specialized equipment.
The United States currently leads the world in installed CCUS capacity, with 19 commercial-scale facilities with combined capture capacity of 22 million tonnes per annum (MTPA) in operation and over 200 MTPA in announced projects as of 2024.34,35 Full deployment on industrial applications will require expanding CO2 transport networks, potentially 30,000 to 96,000 miles of pipeline, and accelerating the permitting and development of underground storage, e.g., Class VI wells. Federal incentives such as the section 45Q tax credit and funding from the IIJA36 and IRA37 are already driving billions of dollars in investment and enabling project deployment in sectors including cement, refining, hydrogen, and steel. The U.S. Department of Energy (DOE) estimates the United States will need to capture and store between 400–1,800 MTPA of CO2 annually by 2050 to stay on track for net-zero goals.38,39
Alternative Production Processes
Alternative production processes refer to fundamentally new methods of manufacturing industrial materials that break from traditional fossil-fuel-based, high-emissions pathways. These technologies aim to eliminate or drastically reduce combustion-related and process emissions by rethinking both the chemical inputs and physical steps used in production. Examples include hydrogen-based directly reduced iron (H2-DRI) in steelmaking, electrochemical cement production, and non-fossil feedstock-based chemical processes.
While not yet widely commercialized, these innovations hold the potential to deliver deep emissions reduction, often approaching zero emissions when powered by clean electricity. Scaling these processes will require extensive investment in new infrastructure, low-carbon feedstock supply chains, and long-term market transformation, but they represent some of the most promising avenues for reducing emissions in hard-to- abate industrial sectors.40
Alternative production pathways for heavy industry have the potential to reduce costs relative to traditional processes by leveraging technological advancements that can be rapidly scaled. While these new methods are still emerging, pilot projects are crucial for gaining experience and achieving learning-related cost reductions. The potential for cost savings depends on the technology’s complexity; as shown in Figure 2, simpler, modular technologies such as electrochemical processes (Type 1) tend to have higher learning rates with more rapid cost declines, whereas more complex, customized systems such as CCUS (Type 3) may only realize moderate savings due to their complexity and customization needs.
Figure 2: Framework for understanding potential of energy technologies to achieve learning-based cost savings

Feedstock Substitutions
Feedstock substitution involves replacing conventional raw materials (often fossil-based or emissions-intensive) with lower-carbon, recycled, or bio-based alternatives. This pathway targets process emissions that arise from chemical reactions intrinsic to many industrial processes (e.g., calcination in cement or reforming in chemicals) without necessarily requiring a complete redesign of production systems. Substitutions can include waste- derived inputs such as fly ash,41 slag, or biomass residues; non-carbonate minerals such as magnesium silicates; or carbon-neutral inputs such as captured CO₂ or low-emissions hydrogen. These substitutions may serve multiple roles: reducing the emissions intensity of inputs, altering chemical pathways to avoid CO₂ release, or enabling downstream electrification.
While some feedstock substitutions are already in widespread use (e.g., scrap steel in steelmaking and fly ash and slag in cement), others remain in early stages of research and demonstration. The TRL for feedstock substitution ranges widely from TRL 4 to 9, depending on the material, process integration needs, and market availability.41 As such, feedstock substitution serves as both a near-term emissions reduction tool and a long- term enabler for deeper industrial transformation.
Alternative Fuels
Alternative fuels are energy sources used to replace conventional fossil fuels that, depending upon the life- cycle analysis of emissions, can lower the emissions intensity of generating industrial heat—a major source of direct emissions across heavy industry. These include biomass-derived fuels, certain waste-derived fuels, some renewable natural gas (RNG), low-emissions hydrogen, and low-emissions-hydrogen-derived fuels.43 The emissions reduction potential of alternative fuels depends considerably on their life-cycle emissions, local availability, and compatibility with existing infrastructure. In some cases, they can be blended with fossil fuels to incrementally reduce GHG emissions or, with more extensive retrofits, fully displace traditional fuels. The role of alternative fuels is especially important in high- temperature applications that are difficult to electrify in the near term. Their deployment can serve as both a transitional bridge and a long-term complement to deeper decarbonization technologies.
While some waste-derived fuels and conventional biofuels are already commercially available and widely used in some industries (TRL 8–9), the availability of advanced biofuels, low-emissions hydrogen, and synthetic e-fuels are still developing and face infrastructure, supply chain, cost, and efficiency barriers.44,45 TRLs for the use of alternative fuels vary by application and while useful for gauging technical maturity, do not fully capture real-world scalability. Even technologies nearing commercial readiness may face significant constraints related to fuel supply, infrastructure buildout, and energy inputs. For example, bioenergy (solid, liquid, gaseous) pathways in some regions may be constrained by the availability of sustainable biomass and related supply chains, while low-emission hydrogen-based fuels depend on access to clean electricity, electrolyzers, carbon capture equipment, sequestration facilities, and/or supportive delivery infrastructure.
Energy and Materials Efficiency
Energy and materials efficiency encompass a range of strategies aimed at reducing the energy and resource intensity of industrial production. This includes equipment upgrades (e.g., high-efficiency motors, heat exchangers), process optimization (e.g., improved controls, heat integration), and better use of materials (e.g., reducing overdesign, extending product life, circularity). These measures are generally low- cost, commercially mature (TRL 9), and often deliver immediate emissions reductions without requiring major changes to core production methods.46,47
While individual interventions typically yield modest reductions, their cumulative potential is substantial, particularly when deployed alongside other emissions reduction strategies. Efficiency improvements also reduce demand on electricity and fuel infrastructure, making them a foundational enabler of broader industrial transformation. Importantly, materials efficiency measures such as reducing waste, increasing recyclability, or extending product lifetimes can also reduce embodied emissions, especially in sectors such as cement and steel where product demand is closely tied to infrastructure development.48,49 However, investments in efficiency alone may inadvertently extend reliance on emission intensive systems by improving their economic viability and can trigger rebound effects where efficiency gains are offset by increased production or consumption. Furthermore, efficiency measures on emissions-intensive processes, while valuable, cannot alone achieve complete emissions reduction.
SECTION 3
U.S. Policy Landscape
Over the past several years, the United States has experienced unprecedented growth in low-emission industry, fueled by the extensive technological innovation, landmark federal investments, and a surge of state-level policy mechanisms. In a highly uncertain federal political environment, states across the political spectrum are advancing a diverse array of industrial innovation strategies to drive economic growth, enhance competitiveness, and accelerate emissions reductions. This section examines the current federal and state policy context, highlighting bipartisan trends and the interplay between national initiatives and state-led action.
Federal Industrial Policy Context
From 2021 to 2024, the United States saw historic investment in clean industry and manufacturing, largely driven by the bipartisan Infrastructure Investment and Jobs Act (IIJA) and the Inflation Reduction Act (IRA).Between August 2022 and May 2025, as many as 2,369 new large-scale, low-emission energy and industrial facilities had opened across the U.S., attracting $321 billion in private capital investment.50,51,52 The IIJA and IRA targeted the full innovation pipeline and spurred investment through funding for research and development, pilot projects, and demonstrations; expanded tax credits; cost-sharing and loan programs; and new federal offices for implementation. The initiatives are supported by federal, state, and local governments, national labs, certification organizations, and industry partnerships, reflecting the cross-sector coordination needed to scale low-emission solutions.53
More recently, Congress and the administration took steps to remove or weaken many clean energy tax credits and programs in these laws, by passing H.R.1. The law accelerates phase-outs for wind, solar, and hydrogen tax credits, imposes stricter domestic content and sources rules on all energy tax credits, and rescinds all unobligated funding for IRA programs. Additionally, the future of previously obligated funds remains uncertain due to administrative capacity constraints and the forthcoming federal appropriations process.
Though the future of these programs is uncertain, IIJA initiatives relevant to low-emission industry include the following:
- New offices within DOE, such as the Office of Clean Energy Demonstrations and the Sustainable Manufacturing Initiative, created to promote early-stage research, development, and demonstration, and facilitate the technology-to-market process.54
- $6.3 billion for the Industrial Demonstrations Program to support the demonstration of emerging technologies at commercial scale. 18 of the 31 projects have been canceled as of May 30, 2025.
- $2.54 billion for carbon capture demonstration projects. two of the three full-scale demonstration projects which were awarded in 2024, have been canceled by DOE as of May 30, 2025.55
- $937 million for carbon capture large scale pilot projects. As of May 30, 2025, 3 of 4 projects awarded in 2024 were cut by DOE.
- $7 billion to create regional clean hydrogen hubs, which aim to accelerate clean hydrogen production for use as dispatchable power, energy storage, and reducing emissions in heavy industries and transportation. 7 hubs have been announced, each focusing on different clean hydrogen production methods56 and industrial users such as refining and fertilizer production.
- $2.1 billion for carbon dioxide pipelines were allocated through the Carbon Dioxide Transportation Infrastructure Finance and Innovation Program—via federal loans, loan guarantees, grants, and administrative expenses, thereby reducing financing risks and encouraging private sector investment. The first $500 million tranche opened in May 2024, but no applications were received by DOE.
- Numerous policies that support advanced and lower- carbon materials, including $310 million in grants for state and local procurement.
The IRA included policies that promote industrial innovation at the state level,57 including the following:
- $100 million through 2026 to the Environmental Protection Agency (EPA) for a voluntary low-carbon labeling program for construction materials, developed in collaboration with the Federal Highway Administration (FHWA) and the General Services Administration (GSA).
- Grants and technical assistance to manufacturers for measuring and disclosing embodied carbon in products, in addition to $2.15 billion in IRA funding through 2026 for the use of low-carbon materials in federal buildings.
- $975 million to support emerging sustainable building materials technologies.
- $1.2 billion for road construction materials with substantially lower emissions than traditional options under FHWA’s Low Carbon Transportation Materials Program.
- $5.8 billion for DOE to assist eligible entities in purchasing, installing, or retrofitting advanced industrial technologies in energy-intensive industries such as steel, cement, and chemical production. DOE prioritizes projects based on expected pollution reductions and community benefits. These funds, available through 2026, are expected to be used alongside private funds and those from IIJA to support a total of 33 projects.
- Greater incentives for CCUS, namely a higher 45Q tax credit for captured CO2 from $50 to $85 per ton for projects that permanently sequester CO2. This credit now applies to industrial emitters with a reduced capture threshold from 25,000 to 12,500 metric tons of CO2 and extended the credit through 2032.58
- Expansion of several other tax credits relevant to the industrial sector, including the 45V production tax credit for low-emission hydrogen, the 45Z clean fuel production credit for alternative biofuels and biodiesel, and the 48C advanced energy project credit, which includes a category of industrial or manufacturing retrofits.59
Additionally, the federal government started working to enhance rules governing the pipeline transport of CO2. Over 5,000 miles of CO2 pipelines are already in operation under federal and state oversight, though expansion will likely be needed to support widespread industrial use of CCUS and move CO2 safely from source to geologic storage. Under the Biden administration, the Department of Transportation’s Pipeline and Hazardous Materials Safety Administration proposed new safety standards for CO2 pipelines; the rulemaking process has since stalled.
Though IIJA and IRA have helped significantly increased the number of planned projects, the future of federal support for these investments remains uncertain, leading to delays and cancelations of low-emission energy, industry, and infrastructure projects.60,61,62
State Industrial Policy Context
States are advancing a variety of low-emission industry policies that support economic growth and emissions reduction, achieving bipartisan objectives such as economic development, competitiveness, and technology innovation. Throughout this section, state- specific examples illustrate the diverse range of policies currently being adopted. Table 8 below highlights several of these, offering insights and lessons that can guide other states in effectively designing and implementing policies tailored to their unique industrial contexts.
Table 8: State-specific examples of low-emission industry policy leadership

SE C TION 4
State-Led Policies for Modernizing Heavy Industry
States have a diverse and expanding toolkit to accelerate low-emission industrial innovation that they can tailor to their unique economic landscapes and industrial bases. Because the industrial sectors covered in this report are primarily geographically concentrated in politically conservative states, it is critical that industrial policies be designed with those contexts in mind. This section explores the leading policy options—ranging from direct financial support and market-shaping demand policies to regulatory streamlining—that states are leveraging to drive innovation, stimulate demand for low-emission products and materials, and enable practical action across heavy industry. Appendix C outlines all policies covered in this section. For each policy discussed, the report describes how, and examples of where, the policy has worked and identifies key design considerations. Each policy is categorized by its type (legislative and/or administrative), timeline for adoption and impact (near- term: 1-2 years, medium-term: 3-7 years, and long-term: 7+ years), and level of public funding required (modest, moderate, and high).
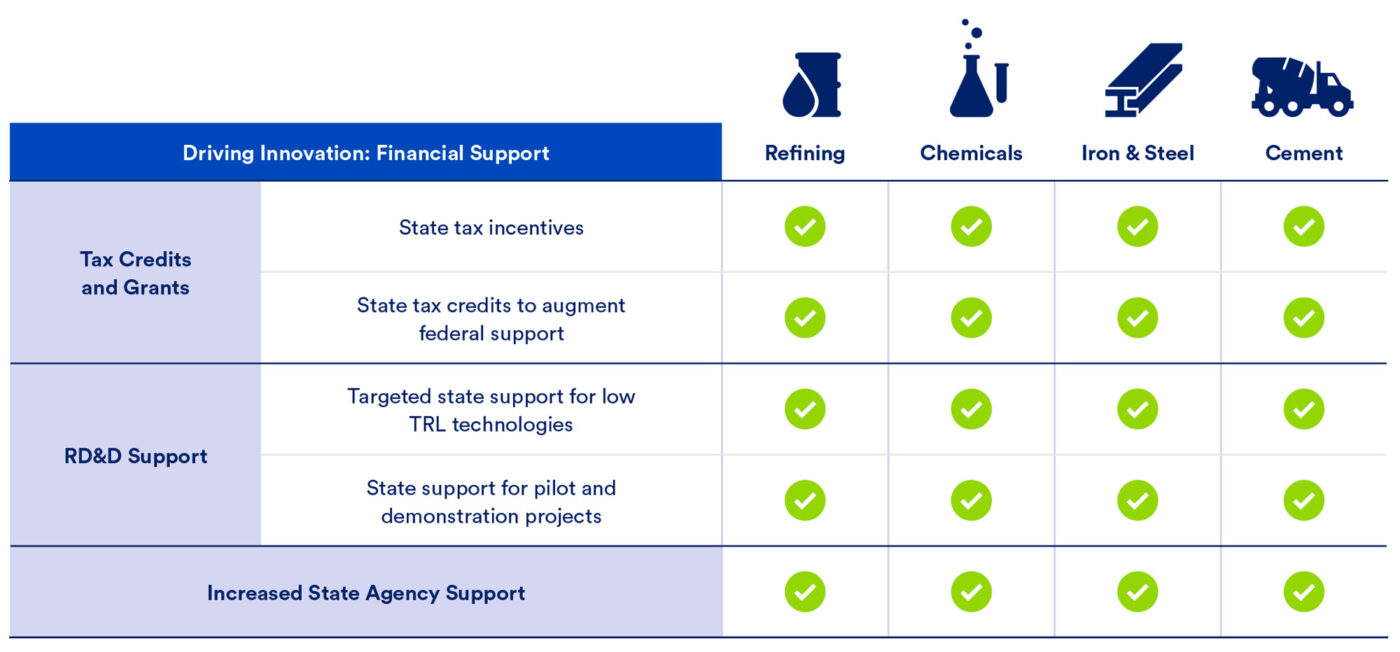
1. Driving Innovation: Financial Support
Targeted financial support helps unlock industrial innovation by de-risking emerging technologies and catalyzing private investment. This section explores the following five state-level policies that drive technology innovation through financial support.
- 1.1. State Tax Incentives: States offer tax credits, exemptions, or bonus incentives for low-emission technologies to reduce cost gaps and support industrial growth.
- 1.2. State Tax Credits to Augment Federal Support: States provide add-on credits to federal incentives that can close cost gaps for new technologies or enable more comprehensive, technology-neutral support.
- 1.3. Targeted State Support for Lower-TRL Technologies: States fund early-stage research and development for lower-TRL industrial technologies, building local innovation capacity.
- 1.4. State Support for Pilot and Demonstration Projects: States co-fund pilot and demonstration projects with private investment to de-risk early deployment, accelerate cost declines, and retain economic benefits in-state.
- 1.5. State Agency Support: State agencies provide technical assistance, workforce training, and policy coordination to scale low-emission industry and investment.
These financial support policies apply to all four industrial subsectors, which Figure 3 below highlights. This broad applicability results from strategic opportunities to advance supportive infrastructure (e.g., pipelines and grid infrastructure) and early- stage technologies across all subsectors. Importantly, each subsector can benefit from targeted financial interventions that accelerate technological innovation and deployment.
Figure 3: Financial support policies for low-emission industry, with subsector mapping
1.1 State Tax Incentives
Tax incentives can help close the cost gap between low-emission and traditional industrial products and technologies. These incentives could take a variety of forms, including tax credits, property tax exemptions, or credit adders for low-emission technologies in economic development programs. States have a long history of using tax codes to create incentives for businesses operating within their jurisdictions, so this approach is a well-established policy option that many states are already comfortable implementing. States can also tailor tax incentives to achieve additional policy goals by, for example, targeting the incentives to economically distressed zones to distribute economic activity more evenly throughout the state.
How and Where This Policy Has Worked
1.1.1 Property, Payroll, or Income Tax Credits:
States often offer property, payroll, or income tax credits or reductions to industrial facilities as an economic development incentive to make themselvesmore attractive business investment environments and to compete against other states. States could establish this type of tax incentive program specifically for industrial facilities that produce lower-emissions products. For example, states could offer low-emission manufacturing and industrial facilities an exemption from property taxes and arrange for these facilities to instead pay a lower amount through a payment in lieu of taxes (PILOT) program. States also could include credit multipliers for low-emission technologies in their existing economic development programs, encouraging the facilities who participate in these programs to produce lower-emissions products. Twenty-one states currently offer tax incentives specifically for manufacturing, so there is an opportunity to tailor these programs specifically to low-emission manufacturing.63 For example, the Industrial Tax Exemption Program in Louisiana offers an 80 percent property tax abatement for up to ten years on new capital investments made by manufacturers in the state.64
1.1.2 Investment Tax Credits:
Another option available to states is to offer an investment tax credit to industrial facilities when they purchase equipment they will use to manufacture low-emission industrial products. Investment tax credits allow a taxpayer to deduct a certain percentage of eligible investment costs from their tax liability. At the federal level, investment tax credits have been successful in increasing renewable energy deployment. At the state level, some states already have experience offering investment tax credits to manufacturing facilities. For example, Georgia currently offers an investment tax credit to manufacturing and telecommunications support companies that have operated in the state for at least three years. Companies that invest in recycling equipment, in pollution control, or in converting a defense plant to a new product are eligible for a 3 to 8 percent tax credit, and general equipment investments are eligible for a 1 to 5 percent credit.65
Georgia currently offers an investment tax credit to manufacturing and telecommunications support companies that have operated in the state for at least three years.
1.1.3 Accelerated Tax Depreciation Schedules:
States can offer accelerated tax depreciation schedules for low-emission industrial equipment. Accelerated tax depreciation decreases upfront costs by allowing firms to deduct capital expenditures from their taxable income more quickly than under straight line depreciation, thereby reducing corporate income tax payments. State corporate tax rates are typically much lower than the federal rate, which limits the magnitude of this benefit in most states. However, offering accelerated depreciation schedules for low-emission industrial assets could still provide a valuable tax benefit to companies.
1.1.4 Tax Equity Partnerships:
Tax equity partnerships allow companies to gain access to cash financing for projects that will be eligible for tax credits. The partnerships generally involve one party agreeing to assign the rights to claim tax credits to another party in exchange for an equity investment.66 According to the Congressional Research Service, this arrangement can be beneficial in cases when “tax credits are nonrefundable and the intended beneficiary of the tax credit has little or no tax liability (e.g., a nonprofit), or because the credits are delivered over multiple years whereas upfront funding is needed to break ground.67 State-sponsored tax equity partnerships can help to increase access to these benefits by combining state tax credits and risk guarantees with federal incentives, making projects more financially attractive to investors. This public-private partnership model could accelerate industrial modernization by mobilizing private capital at lower costs while sharing project risks with the state. While not previously implemented for low-emission industry, over 20 states provide state-sponsored tax equity through state low-income housing tax credit programs, partnering with investors to reduce upfront capital costs and make affordable housing projects financially viable.68
While not previously implemented for clean industry, over 20 states provide state-sponsored tax equity through state low-income housing tax credit programs, partnering with investors to reduce upfront capital costs and make affordable housing projects financially viable.
Implementation Strategies
| Policy Type | Legislative to authorize funding and establish program authority. Once authorized, state departments of revenue and economic development agencies would administer the tax incentive programs. |
| Duration | Near-term adoption, medium- to long-term impact. |
| Funding Required | High, depending on technology uptake, because many tax incentives provide ongoing payments to industrial producers and reduce net tax revenue. |
Policy Design Considerations
- Reduces government revenue: Tax incentives reduce government revenue because the businesses that receive them pay less in taxes. This effect may be partially offset by increases in other forms of tax revenue from economic activity driven by the industrial facility, such as increased state personal income and sales tax.
- Limited influence on corporate site selection: Tax incentives may not be the most important factor influencing where industrial facilities choose to locate. For example, availability of skilled labor and adequate land and infrastructure are two important drivers of corporate site selection that are not typically affected by tax incentives.
- Risk of picking winners and losers: Typically, a state tax incentive benefit would detail the specific equipment or investment type that qualifies. This may lead to perception of picking technology winners and losers. This could undermine public support for these tax credits. However, states can avoid this concern by making the tax credits broad and applicable to a range of low-emission industries and technologies.
1.2. State Tax Credits to Augment Federal Support
In addition to offering their own tax incentives as discussed above, states can offer credit adders to augment existing federal tax credits. Given that there will likely continue to be a cost premium for low- emission industrial products, establishing incentives that make these technologies cost-effective for industrial facilities will be key to their wider deployment. However, federal tax credits may not be sufficient on their own to incentivize meaningful levels of investment in low-emission technology in many industrial sectors, especially as U.S. inflation has increased. State-level credit adders could help close the cost gap for low- emission technologies in sectors where adopting these technologies is more expensive than current federal incentive levels. Further, while most federal credits are technology specific, states can create technology- neutral tax credits tailored to complement federal support; this strategy could incentivize a chemical plant, for example, to pair state-supported electrification of low-temperature heating with federally supported CCUS for process emissions. Augmenting federal support helps states use their own funds more efficiently.
How and Where This Policy Has Worked
States can tailor additional incentives to meet their specific needs. For example, states could structure these adders either as production tax credits (per ton of low- emission product produced), as investment tax credits (cover a portion of the project capital costs), or as a tax credit designed to reward the producer for lowering facility or product emissions intensity. States could also target these incentives to specific industries—such as cement, petrochemicals, and refining—based on the subsector cost gap or economic relevance. In 2024, New Mexico enacted a 20 percent investment tax credit for manufacturing facilities that qualify for the federal 45X advanced manufacturing production tax credit.69
States can ensure that an industrial facility is able to stack the state and federal credits to make projects more financially viable. For example, the 45Q CCUS federal tax credit provides a financial incentive up to $85 per ton of captured CO2 from industrial facilities that permanently sequester the CO2. The cost of storing captured carbon in some industrial sectors, such as refineries and steel mills, can be similar to or even higher than $85.70 These sectors would benefit from higher state credit adders, or other financial incentives, such as voluntary carbon markets, to be fully cost-effective.
Notably, in 2025, New Mexico proposed legislation71 featuring a state production tax credit for $85/ton of CO2 reduced below a benchmark, along with a 10 percent investment tax credit for low-carbon industrial equipment. While the state-level $85/ton credit could not be stacked with the federal 45Q tax credit, the investment tax credit can be compatible with other federal tax credits. Although this bill did not pass, this bill could be considered in a future legislative session.
Implementation Strategies
| Policy Type | Legislative to establish new tax credits or authorize supplementary funding. |
| Duration | Near-term adoption; medium- to long-term impact. States could design credit adders that gradually phase out to avoid subsidizing technologies indefinitely. |
| Funding Required | Moderate to high, depending on level of technology uptake and state tax credit levels. |
Policy Design Considerations
- Setting credit at competitively attractive levels: A state supplementary tax incentive would have to be set at a level high enough to incentivize increased investment while avoiding being overly generous. Tailoring tax incentive levels and design to specific industries can help make efficient use of state funds. However, fully closing the cost gap for technologies, such as CCUS adoption in certain industries, may be prohibitively expensive for state governments. This approach may not be realistic unless the federal government further increases the value of credits.
- State monitoring and verification: With state funds at stake, state officials would want to ensure that recipients are abiding by compliance mechanisms, which could require additional staff and auditing expertise to ensure that recipients are accurately reporting emissions and investment. The state tax authorities could piggyback on federal reporting requirements and standards.
- Need for supporting infrastructure: Deployment of low-emission technologies depends on the availability of adequate transportation and storage infrastructure and offtakers, which may require additional state and federal support or reform.
1.3. Targeted State Support for Lower-TRL Technologies
While many low-emission industrial technologies are ready for deployment today, others are currently at lower TRLs and will require targeted research and development (R&D) to advance them to the point where they are ready for demonstration, eventual commercialization, and market take-off. States can play a valuable role in R&D of low-emission industrial technologies, both by conducting R&D directly and by providing funding to universities, private companies, and nonprofits for R&D activities.
State support for R&D builds a local knowledge base and may subsequently encourage industrial facilities to locate within the state once the technologies under development reach commercialization, creating economic growth and innovation hubs. By supporting a range of lower-TRL technologies, state can help ensure that key industries have multiple low-emission pathways available as technologies mature, preserving operational flexibility and strengthening economic resilience.
How and Where This Policy Has Worked
All 50 states already have budgets for R&D activities, and in 2023, total state agency spending on R&D was $3 billion.72 Most of this amount (76 percent) went to external organizations such as higher education institutions, private companies, and nonprofits.73 The remaining 24 percent was funding for R&D performed directly by state agencies.74 Currently, healthcare dominates state R&D expenditures, followed by environment and natural resource research and then research in the energy sector.75 In 2023, the five states with the highest total R&D budgets were California, New York, Texas, Florida, and Ohio.76 These and other states can build on the success of their existing R&D programs to dedicate additional funding to low-emission industrial technologies.
States can also provide R&D funding to supplement federal funding. For example, Arizona State University leads a clean energy manufacturing innovation institute, partially funded by the Department of Energy, dedicated to decarbonizing process heat, including in the iron and steel, cement, chemicals, and petroleum refining industries.77 Other higher education institutions that are partners of this institute include the University of Texas at Austin, Carnegie Mellon University, Missouri S&T, Texas A&M, Tuskegee University, NC State University, Navajo Tech University, and Stanford University. State governments can play a valuable role in providing supplemental funding to ensure that research efforts can continue, even with federal uncertainty.
Arizona State University leads a clean energy manufacturing innovation institute, partially funded by the Department of Energy, dedicated to decarbonizing process heat, including in the iron and steel, cement, chemicals, and petroleum refining industries.
Implementation Strategies
| Policy Type | Legislative to authorize funding. A combination of state agencies and partner organizations, such as higher education institutions, private companies, and nonprofits, would carry out the R&D. |
| Duration | Near-term adoption; medium- to long-term impact. |
| Funding Required | Medium; impact will scale with amount of funding provided. |
Policy Design Considerations
- Need to secure funding: Whether performed directly by state agencies or by partner organizations such as universities and private companies, R&D requires consistent funding. This funding involves an opportunity cost because government funds dedicated to R&D cannot be used for other purposes. Additionally, these funds should be committed for a long enough time horizon to incentivize R&D investments. State annual budgeting processes could complicate efforts to develop long-term funding streams.
- Emissions impact ramps up over time: Not all technologies will ultimately succeed, and the emissions reduction from R&D programs will be low at first until technologies progress to the point where they can be deployed at scale.
CASE STUDY 1: MISSOURI
Missouri Cement Decarbonization: Using Federal Grants to Accelerate Low-Carbon Innovation
Overview
In 2024, the Missouri Department of Natural Resources (DNR) released its Plan for Environmental Improvement Grants to guide the distribution of federal implementation funds through the U.S. EPA’s Climate Pollution Reduction Grant (CPRG) program.
The plan clearly establishes the framework for industrial decarbonization funding and highlights industrial sources—including cement—as major contributors to Missouri’s statewide emissions. The plan positions Missouri to leverage federal support for clean heat, fuel-switching, and emissions control technologies across hard-to-abate sectors like cement.
Policy Design
Through this plan, DNR invited local governments and planning commissions to submit project ideas in partnership with private industry, utilities, and community stakeholders. DNR also awarded subgrants of up to $10,000 to 14 regional partners to host workshops and gather input on community- prioritized emissions reduction strategies. Industrial decarbonization, including process upgrades and pollution control retrofits, was explicitly included as a priority project category. The plan’s inclusive structure creates a pathway for facilities such as Missouri’s four Portland cement plants to participate in CPRG-funded decarbonization through eligible public-sector sponsors.
Industry Stakeholders
Missouri is home to major cement producers including Continental Cement, Holcim, Buzzi Unicem, and Ash Grove. These companies operate facilities that contribute materially to Missouri’s industrial emissions and are well- positioned to pursue funding for retrofits, clean fuels, and supplementary cementitious materials (SCMs). While the plan does not name specific projects, the structure strongly encourages public-private collaboration that could support these low-emission pathways.
Expected Impacts
- Strong foundation for cross-sector collaboration that could support future cement decarbonization projects, including public-private grant applications.
- Increased institutional capacity at the regional level to manage large federal energy investments, especially through regional planning commissions and municipal utilities.
- Stronger alignment of industrial emissions priorities with federal funding streams, improving Missouri’s competitiveness for future DOE or EPA awards.
- Community co-benefits, such as local air quality improvements and retained industrial jobs in traditionally underserved or economically distressed regions.
Policy Rationale
- Targets near-term emissions reductions from major point sources, including cement kilns.
- Advances deployment of clean heat, alternative fuels, and materials efficiency in hard-to-abate sectors.
- Aligns with Missouri’s Priority Climate Action Plan, which identifies industrial processes as a top low-emission target.
- Leverages federal investment to build durable public- private infrastructure for long-term emissions planning.
- Missouri’s cement-related emissions rose from 2.5 MMT CO₂e in 2005 to 4.4 MMT CO₂e in 2021, making it a priority area for industrial emissions reductions.
- The plan aligns with CPRG goals to reduce both greenhouse gases and criteria air pollutants in sectors with large stationary sources.
- Collaborative project scoping through regional councils encourages local economic development while reducing emissions.
Case study citations provided in Appendix D.
1.4. State Support for Pilot and Demonstration Projects
While the policy described above targeted early- stage technologies that require further research and development, this policy addresses more mature technologies that need support in early-stage deployment. Specifically, it addresses government funding for pilot and demonstration projects to support technologies that are at a higher TRL and are ready for larger-scale demonstrations. While pilot and demonstration funding for emerging technologies has historically been provided primarily by the federal government, states can create similar incentives. State funding can provide a cost-share with industry to construct pilots that bring down costs for future projects by advancing technologies from “first-of-a-kind” to “nth- of-a-kind,” thereby unlocking learning-curve benefits. Funding for pilot and demonstration projects can help ensure that technologies, including those for which R&D takes place within the state, remain within the state into the commercialization stage and continue to bring jobs and economic benefits.
How and Where This Policy Has Worked
Government funding for pilot and demonstration projects generally supplements private funding and can play an important role in derisking technologies through building a road to financial bankability. Without state or federal support, emerging technologies can find it difficult to attract private capital for pilot and demonstration projects, due to their risk profiles. States could offer support similar to the Industrial Demonstrations Program (IDP), an IIJA- and IRA-funded program that provided $6 billion in federal funding to support 29 first-of-a- kind industrial projects across the country, leveraging an additional $14 billion of private investment for a federal cost-share of about 30 percent. The IDP was 10x oversubscribed, with over $60 billion requested in funding requested and $100 billion in industry cost share, indicating significant cross-sector interest.78
Though this program has been partially canceled, state governments could replicate this model to fund additional demonstration and pilot projects in industries most relevant to their local economies. One such approach is the use of state sovereign wealth funds to capitalize a low-emission industrial technology fund. The North Dakota Legacy Fund, established in 2010 and capitalized by 30 percent of state oil and gas tax revenues, is designed to ensure long-term financial stability beyond the state’s fossil fuel economy. North Dakota allocates a portion of its earnings to initiatives such as the Clean Sustainable Energy Fund, which supports carbon capture and low-emission technology projects.79
North Dakota allocates a portion of its [state oil and gas tax revenues, through the North Dakota Legacy Fund] to initiatives such as the Clean Sustainable Energy Fund, which supports carbon capture and low-emission technology projects.
Another financial support approach to lowering investment risk for low-emission industry is state-backed insurance guarantees that provide a backstop covering losses beyond a certain threshold. These guarantees reduce private insurers’ exposure and encourage them to insure innovative or higher-risk technologies that might otherwise lack coverage or face prohibitively high premiums.
Implementation Strategies
| Policy Type | Legislative to authorize funding. State agencies would administer the program in partnership with private companies. |
| Duration | Near-term adoption; medium- to long-term impact. |
| Funding Required | Moderate; impact will scale with amount of funding provided, and per-project costs are generally higher than for R&D. |
Policy Design Considerations
- Need to secure funding: A primary barrier to wider state support for pilot and demonstration projects is the need to secure dedicated, long-term funding.
- Available cost savings vary by technology: The goal of government-supported pilot and demonstration projects is generally to reduce costs for future projects by gaining experience constructing the technology at larger than bench-scale. Depending on the technology, a risk of funding pilot projects is that the projects may not yield hoped-for cost reductions. Technologies with low degrees of complexity and need for customization tend to have the highest learning rates, which is the percent reduction in project costs associated with each doubling of installed capacity.80 Some technologies that will be key to low-emission industry have high complexity and/or high requirements for customization. Consequently, these have lower potential for learning-curve savings.
- Emissions impact ramps up over time: The direct economic and emissions abatement impact of pilot projects will be small at first but will enable future reductions.
1.5. Increased State Agency Support
State agencies play a facilitating role connecting industrial facilities with technical assistance and workforce training, as well as building awareness for available government programs, including state tax credits and energy efficiency programs. The presence of a trained workforce in a state can help attract additional industrial facilities to the state, contributing to a positive feedback loop. State agencies also have a high-level planning role that includes communicating a state’s priorities and long-term commitment to fostering low- emission industry.
How and Where This Policy Has Worked
State agency support for industrial emissions reduction can take a variety of forms.
1.5.1. Technical Assistance:
One important role for states is to provide technical assistance to industrial companies. Some states provide technical assistance directly through their state agencies, which requires the agencies to have staff with specific technical expertise. Often a more efficient use of state resources is for states to play facilitative roles, connecting industrial companies with external partners that specialize in low-emission technologies. For example, Illinois proposed to establish a Clean Industry Concierge Program as part of its Climate Pollution Reduction Grant. The state would hire a third party to “help Illinois industrial facilities navigate, coordinate and access funding opportunities, get support in designing and implementing decarbonization measures, and provide strong guidance on industry best practices in efficient and cost-effective low- carbon technologies and processes.”81 The program would provide contractor and supply chain connections and education, strategic planning support, workforce training liaisons, and low-emission industry planning and stakeholder engagement.82
Illinois proposed to establish a Clean Industry Concierge Program as part of its Climate Pollution Reduction Grant. The state would hire a third party to “help Illinois industrial facilities navigate, coordinate and access funding opportunities, get support in designing and implementing decarbonization measures, and provide strong guidance on industry best practices in efficient and cost-effective low- carbon technologies and processes.”
States can also provide funding to technical assistance and workforce training programs at universities, including at existing Industrial Assessment Centers or Manufacturing USA centers. There are over 50 Industrial Assessment Centers across the country, which provide energy efficiency assessments to small- and medium- sized manufacturers, as well as grants to implement the suggested improvements. States could investigate expanding the mission of these centers to include low- emission technologies alongside energy efficiency.
In addition to the Industrial Assessment Centers, other universities have existing technical assistance programs that allow faculty and students to partner with the private sector and share their technical expertise. States could provide additional funding to deepen these programs’ focus on low-emission industrial technologies. Additionally, there are 18 Manufacturing USA centers across the United States. These serve as research centers for advanced manufacturing technologies and products and aim to develop public-private partnerships with universities, industry, and the federal government. More broadly, states can work to establish cross-state, regional, or national technical assistance partnerships to ensure that industrial players are able to take full advantage of knowledge sharing from innovations occurring in other parts of the country.
1.5.2. Financial Matchmaking
Access to capital can be a barrier to projects. States can help companies access capital by connecting them to private and public institutions that provide financing. Options include venture capital, philanthropic funding, state green banks, and community bonds. Sixteen states and the District of Columbia currently operate green banks, which are public, quasi-public, or nonprofit entities that leverage public and private capital to offer financing to projects that reduce GHG emissions.83 Several states also recently established State Energy Financing Institutions (SEFI) to leverage state dollars to bring federal Loan Programs Office financing to their states.84 Projects financed by SEFIs generally rely on a combination of state, federal, and private investments to achieve the full capital investment needed. The most appropriate financing source will depend on the length of time a project needs to achieve a return on the investment, as well as its risk level; public institutions are often able to offer more patient capital than private lenders. Green banks, for example, often offer loans at lower than typical market rate or take on risks that the private market would not accept, allowing them to target market gaps not served by private financial institutions.85
1.5.3. Tax Credit Accessibility Assistance:
Within their own agencies, states can work to improve the accessibility of programs targeted at industrial facilities, such as offering tax credit accessibility assistance and expanding energy efficiency and energy management programs offered through state energy offices.
1.5.4. State Decarbonization Roadmaps:
State energy or environment offices can work to incorporate more robust industrial sector targets into state decarbonization roadmaps. These targets, while generally not be binding on their own, are important signals of a state’s long-term commitment to supporting the expansion of innovative industrial facilities.
Implementation Strategies
| Policy Type | Legislative to authorize creation of or changes to state programs. State agencies implement those programs and design roadmaps to achieve the legislative targets. |
| Duration | Near-term adoption and impact. |
| Funding Required | Relatively modest, especially if states focus on connecting industrial facilities with external technical assistance and financial institutions. |
Policy Design Considerations
- Must be paired with industry outreach and financial incentives: There is a risk that technical assistance programs could fail to reach their intended audiences or that the suggested technologies may face difficult economics that prevent them from being adopted. Pairing state agency support with other low-emission industry programs will be important for overall effectiveness.
- Making efficient use of limited state resources: States can make their limited funds go further if they partner with external organizations to provide technical assistance, rather than attempting to provide all the technical assistance directly from within their own agencies.
2. Stimulating Demand: Low-Emission Markets
Robust demand-side policies are essential to create viable markets for low-emission products and technologies. This section discusses a set of policies that states can use to send clear market signals that accelerate private sector investment and the transition to cleaner products:
- 2.1. Environmental Product Declarations (EPDs): EPDs require manufacturers disclose verified environmental impacts of their products, enabling transparent comparison and forming the foundation for other low- emission procurement policies.
- 2.2. State Contracts for Difference (CfDs): CfDs guarantee a minimum price for low-emission products, reducing financial risk and encouraging investment in technologies; these are most effective when paired with EPDs and procurement standards.
- 2.3. Preferential Bidding for Low-Emission Products: States offer bid discounts or bonuses to contractors using low-emission materials, directly incentivizing cleaner products and relying on EPDs for verification.
- 2.4. Material Embodied Emissions Standards: These standards set maximum emissions limits for materials in state projects, driving innovation and continuous improvement, with EPDs providing the necessary data for enforcement.
- 2.5. Long-Term Procurement Commitments (AMCs, Clean Buyers Groups, Multi-State Procurement): States and buyers commit to purchasing low-emission materials in advance, providing market certainty and supporting private investment, especially when combined with EPDs and financial incentives.
These demand-side policies are mutually reinforcing and often interdependent. EPDs provide the essential data backbone for all other policies, enabling transparent comparison and verification of product emissions. CfDs and procurement commitments help de-risk early investment and drive down costs as markets scale, while preferential bidding and standards ensure that public funds are spent on low-emission materials, creating reliable demand. Figure 4 identifies target industrial subsectors for each policy.
Figure 4: Market-based policies for low-emission industry, with subsector mapping
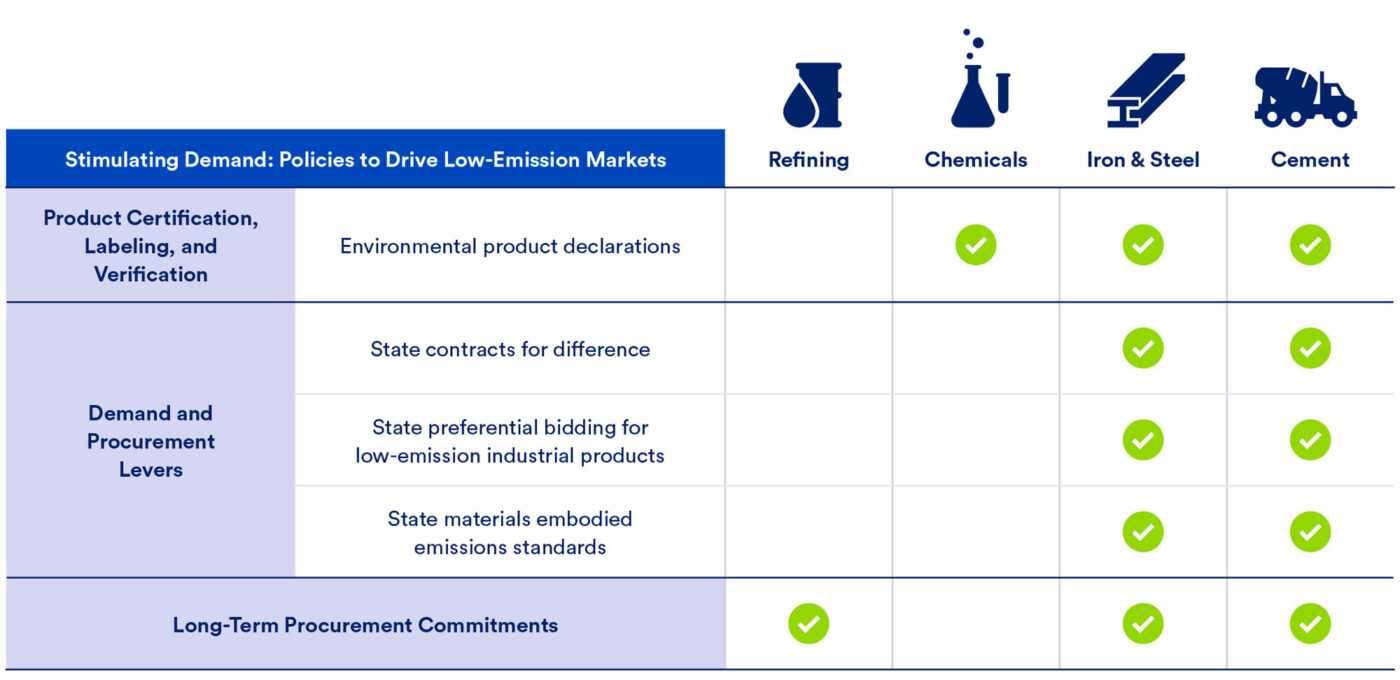
2.1. Environmental Product Declarations
EPDs provide detailed information about a product’s environmental impact across its life cycle—from extraction to delivery (“cradle to gate”). EPDs are disclosures and do not themselves cause any emissions reductions. However, requiring more consistent EPDs is a key enabling policy that would create transparency around the emissions intensity of industrial products, allowing for effective implementation of complementary policies that require use of lower emissions products.
Several states require material manufacturers to provide third-party verified EPDs that follow recognized product standards for key construction materials (e.g., steel, concrete, asphalt) in state-funded projects,86 but most EPDs today are voluntary and created by industry groups or individual companies. EPDs build confidence among consumers, government, and industry stakeholders by establishing a consistent, science-based approach to evaluate product impacts and create a level playing field of consistent disclosure requirements.
How and Where This Policy Has Worked
Manufacturers develop EPDs by conducting a life-cycle assessment in accordance with standardized product category rules, which are then verified by a third party. While companies can publish EPDs voluntarily, states can accelerate adoption by requiring or prioritizing them in public procurement. States can also assist businesses in developing EPDs, given the technical requirements and costs to develop high-quality EPDs.
Several states have implemented EPD requirements— California, Colorado, Minnesota, New Jersey, New York, and Washington—and these requirements could be expanded to others through legislation.87 State EPD procurement requirements have historically focused on construction materials but could be expanded to other industrial products.
- Colorado HB 21-1303—Global Warming Potential (GWP) caps for public projects require lower-emitting products, including cement and steel for public projects.
- California requires, through the Buy Clean California Act, collection of EPDs for eligible construction materials, such as carbon steel rebar, structural steel, flat glass, insulation, asphalt, and concrete. These EPDs must conform to industry-specific standards and state regulatory requirements.
- New York’s 2022 Buy Clean Concrete guidelines mandate that all concrete mixes used in state-funded projects have an EPD starting in 2025; it does not include other products such as iron and steel.88
Several states—Oregon, Minnesota, and Georgia—have developed technical assistance programs to support EPD development without or prior to mandating their use. These initiatives aim to help manufacturers, particularly small- and medium-sized, navigate the EPD development process and prepare for potential future requirements.
Companies and industries have begun developing EPDs primarily due to a combination of market-driven demand from downstream customers and other industries, increasing requirements in public procurement policies, and the need for public transparency regarding environmental impacts. The U.S. steel industry, following the example of the cement industry, has begun publishing EPDs for various products.89 Basic chemical products have also started to publish EPDs, albeit more slowly.90
Several states—Oregon, Minnesota, and Georgia—have developed technical assistance programs to support EPDs without mandating their use. These initiatives aim to help manufacturers, particularly small- and medium- sized, navigate the EPD development process and prepare for potential future requirements.
Implementation Strategies
| Policy Type | Legislative to establish EPD and labeling requirements for public projects, with administration by state procurement agencies (for mandate) or environmental agencies (technical assistance programs). |
| Duration | Near-term adoption; medium- term impact as public and private entities adjust their procurement in response to the EPD disclosures. |
| Funding Required | Modest funding required for technical assistance. Third- party verification limits state commitment. |
Policy Design Considerations
- Technical Barriers: EPDs are a first step for state procurement programs such as “buy clean,” but widespread adoption is hindered by the technical expertise required to create and interpret product- specific EPDs. States could offer technical assistance to companies to assist with development of EPDs for their products, while procurement staff in states adopting EPD requirements would need training to interpret EPDs effectively and ensure accurate comparisons.
- Cost of developing EPDs: The process of developing an EPD involves substantial costs, including equipment, expertise, and third-party certification. One study estimated that the cost of creating an EPD ranges from $13,000 to $41,000 per product, requiring 22 to 44 employee-days.91 These costs pose a barrier for smaller companies, particularly those producing a variety of products that need individual EPDs. State and federal support through tax credits, grants, or technical assistance could help offset these costs.
2.2. State Contracts for Difference
CfDs are financial tools that provide price stability by covering the gap between the market price and the cost premium of low-emitting alternatives. Traditionally used in energy markets, CfDs can help scale low-emission industrial products, fuels, and infrastructure—such as low-carbon cement, sustainable aviation fuel, or CO2 transport networks—by making them more competitively priced with traditional products or fossil-fuel-dependent systems.92,93 CfDs are performance-based, technology- neutral, and temporary, designed to be phased out as low-emission products become cost-competitive. CfDs operate as market-driven mechanisms that support innovation without regulation and may be appropriate in jurisdictions favoring limited government intervention. They also help local industries and infrastructure developers stay competitive as demand for low-emission products and systems rises, ensuring businesses can access emerging markets and federal incentives.
While CfDs are typically backed by state appropriations, long-term viability requires diversifying funding sources to address fiscal constraints. Key mechanisms include:
- Blended finance models: Pairing public funds with private capital to de-risk “first-of-a-kind” projects. For example, the U.S. DOE Loan Programs Office co-funds projects to attract institutional investors.
- Permitting fee reforms: Redirecting fees from industrial permits to CfD pools to create a sustained funding source.
- Structured equity: Private investors provide early-stage capital to companies through preferred stock, which offers them protective rights and priority returns. This reduces dependence on state budgets and attracts private investment by balancing risk and reward for investors.
How and Where This Policy Has Worked
To bridge the cost gap, a CfD guarantees a “strike price” for qualifying products. If the market price falls below that strike price, the CfD backer pays the producer the difference. In a two-sided CfD, if the market price rises above the strike price, the producer returns extra revenue to the backer.
The backer is typically the government, using public funds to de-risk early investment. However, private buyers such as corporations seeking low-emitting materials can also play this role, especially in voluntary or procurement-based markets. By offering a premium at the established strike price, producers are incentivized to reduce costs through efficiencies to capture more of the premium. This stability reduces financial risk, encourages private investment, and lowers the cost of capital for clean technologies.94
Originally used in Europe’s electricity market, CfDs have expanded to industrial sectors, including hydrogen and products using carbon capture technologies.95 They have successfully driven investment in the UK’s offshore wind industry, for example, by derisking pricy investments and signaling longer-term commitments.96 The EU’s RePowerEU initiative and Germany’s €4 billion carbon CfD fund for decarbonizing industries such as paper, glass, and steel are examples of their growing application within industrial sectors.97 In the United States, the application of CfDs for industrial products is still emerging, with limited state-level implementation, but there is growing interest in CfDs for low-emitting hydrogen, steel, and cement
The EU’s RePowerEU initiative and Germany’s €4 billion carbon CfD fund for decarbonizing industries such as paper, glass, and steel are examples of CfDs’ growing application within industrial sectors.
Implementation Strategies
| Policy Type | Legislative to authorize funding and establish program authority. Once authorized, state procurement or economic development agencies can administer the program and set strike prices. |
| Duration | Medium-term adoption and impact. Substantial state effort is required to establish target sector or technology and set the strike price. CfDs can eventually be phased down as technologies mature and low-carbon materials achieve cost-parity. |
| Funding Required | States can determine the scale. Opportunity to leverage private capital through partnerships to expand funding. |
Policy Design Considerations
- State commitment: Funding must be available to attract investors, requiring government commitments that go beyond annual appropriations, which can be achieved through dedicated trust funds sourced from permitting or procurement fees. Additionally, the state must have the technical expertise necessary to set appropriate policy goals, determine target sectors or technologies, and establish and manage strike prices effectively.
- Setting Strike Price: Strike price must incentivize investment without creating windfalls for investors or depleting funding prematurely. Bidding through sealed auctions for low-emission materials could help establish the right strike price.
2.3. State Preferential Bidding for Low- Emission Industrial Products
Because state governments are such large purchasers of industrial products, public procurement can be a catalyst for investment and innovation in low-emission materials. One option is to use bidding bonuses to incentivize contractors to incorporate low-emission materials into their contracts.98 Some states already offer bidding discounts during public project reviews to reward lower- carbon materials. Additional discounts could further encourage the adoption of emerging technologies with high decarbonization potential. States could also combine an in-state and low-emission bid bonus to boost local manufacturing and investment.
How and Where This Policy Has Worked
States typically have a centralized procurement office that could manage and oversee this program. Incentives can be provided at either the project bidding or construction stage. At the bidding stage, one common approach is to use low-emission performance price discounts. Under this approach, contractors would submit an EPD with their bid, and state procurement departments would then apply a discount to the price of contracts that propose to use low-emission materials, with better performers receiving larger discounts. The top bid for a state public contract might receive a five to ten percent base price discount for bid evaluation purposes based on its emission performance.
The state procurement department ultimately pays the full proposed price of the contract but evaluates the bid as if it were lower cost, with the result that it will more often select contractors who use lower-emission alternatives.
States already have experience using preferential bidding policies for small-, veteran-, and minority-owned business, as well as for using state-made products, among others.99 Early versions of the Low-Embodied- Carbon Concrete Leadership Act (LECCLA) in New York and New Jersey considered a sliding bid price discount, offering up to a five percent price discount for the top-performing bid, with additional discounts for higher emission reduction potentials, such as use of mineralization-based concretes.100,101 In the end, the two states chose different tools, but this policy could be considered in other states.
Early versions of the Low-Embodied-Carbon Concrete Leadership Act (LECCLA) in New York and New Jersey, considered a sliding bid price discount, offering up to a five percent price discount for the top-performing bid, with additional discounts for higher decarbonization potentials, such as use of mineralization -based concretes.
A different approach relies on post-construction bonuses based on emissions relative to a threshold. Projects that surpass the threshold receive a bonus in addition to the project cost, incentivizing further emissions reductions. Typically, preferential bid bonuses are around 5 to 20 percent and would be paid out only upon performance. This is part of the revised New Jersey LECCLA, which provides tax credits worth five to eight percent of the cost of the project’s concrete up to an annual value of
$1 million per project and $10 million for the state. In this way, New Jersey is using a market mechanism to incentivize low-carbon concrete, while strictly limiting the cost to the state.
Implementation Strategies
| Policy Type | Preferential bidding for state- funded projects would require changes to procurement policies, which will involve executive and potentially legislative action, depending upon state law. State departments, such as departments of transportation, would still be responsible for soliciting, compiling, and comparing bids, and selecting the winning bid based on criteria set by state law and policy. |
| Duration | Near-term adoption, medium-term impact. As the industries become more emissions efficient, the preferential bonus or threshold may have to be updated. |
| Funding Required | Modest to moderate funding impact, depending on the degree of low-emission preference and size of annual state procurements. Not all lower-carbon bids will be more expensive than traditional bids because each contractor may structure their bid to be more competitive. |
Policy Design Considerations
- Setting appropriate bonus level: Any procurement bonus needs to be set at a level that incentivizes firms to bid in with lower-emission materials but does not dramatically increase the costs of state-funded projects or make inefficient use of taxpayer funds by overcompensating firms for actions they would have taken anyway.
- Ensuring bids are using lower-carbon materials: As noted elsewhere, transparent and verifiable third- party EPDs are critical to the success of many state procurement policies. Without the ability to compare different embodied emissions intensities of different construction materials, state procurement officers evaluating bids will not be able to ensure that a bid is entitled to a preferential bid bonus.
- Setting ambitious standards: Eventually, as low-emission technologies and products proliferate, all or most state construction bids will include these products as the baseline. To avoid overcompensating bidders, states would have to periodically adjust the baseline for the standard product and set increasingly ambitious targets for products that would be eligible for the bidding bonus.
2.4. State Material Embodied Emissions Standards
While state preferential bidding is an incentive, material embodied emissions standards set mandatory limits on emissions intensity for materials used in public construction projects. These standards require the use of low-emission alternatives and rely on EPDs to assess material impacts. Essentially, states would set an emissions intensity ceiling per ton for materials they purchase and exclude materials exceeding this threshold, based on EPDs that contractors submit with their bids. States can also promote innovation by setting progressively stricter emissions goals over time, inducing greater emission reductions. This approach leverages state purchasing power to drive investments in low- emission manufacturing. By setting out clear and long- term goals for products’ embodied emissions, states can use their purchasing power to drive capital investment in local low-emission manufacturing.
How and Where This Policy Has Worked
States purchase large volumes annually of iron, steel, cement, fuels, and petrochemical-based products. By setting emissions caps in their procurement, states can create demand for cleaner alternatives. Caps are typically tied to the current industry average and can cover plant-level emissions or include upstream sources. For example, a state might require bids to come in at least 10 percent below the average, then lower that bar by one to two percent each year for a decade. Suppliers that exceed the cap would either need to decarbonize their products or lose access to state contracts.
California, New York, and Colorado are leading the way with low-emission procurement legislation targeting construction materials, such as steel, concrete, and cement.
This standard was being explored at the federal level, with the General Services Administration (GSA) launching a pilot program in 2023 to procure low-carbon materials for 11 projects. The GSA also finalized Low Embodied Carbon Concrete, Steel, Glass, and Asphalt Requirements in December 2023. At the state level, California, New York, and Colorado are leading the way with low-emission procurement legislation targeting construction materials, such as steel, concrete, and cement. California enacted legislation in 2017 to establish facility-specific EPDs and set maximum acceptable global warming potential (GWP) for carbon- steel reinforcing bar, structural steel, flat glass, and insulation in all public-works contracts.102 Colorado’s Buy Clean Colorado Act, passed in 2021, requires EPDs and puts binding GWP caps into force for concrete, asphalt paving mixtures, and steel in state-owned buildings as of January 2024 and for roads and bridges as of July 1, 2025.103 New York’s Buy Clean Concrete Guidelines required concrete be under the set GWP limit by January 1, 2025.104 Other states, such as Minnesota, Washington, and Oregon, are in the ramp-up phases of their embodied emissions standards.
Implementation Strategies
| Policy Type | Legislative or administrative to adopt standards. Administrative to implement through state procurement. |
| Duration | Near-term adoption; medium- to long-term impact. Policy should remain in place for multiple years to provide long- term certainty for businesses interested in investing in low-emission technologies, especially if there is a high-cost premium. |
| Funding Required | Modest to moderate funding is required, due to expected bid price increases for state public contracts. However, given that costs for structural materials are typically only a small portion of total project cost, even large average cost increases in some supply costs will not substantially increase the total cost of the project. |
Policy Design Considerations
- Requires long-term investment signal: For state embodied emissions thresholds to work, the state must demonstrate a long-term commitment to purchasing lower-emission products. If producers are skeptical that a state will honor its commitment, they may not invest in new technologies to meet the product standard.
- States are large, but not majority purchasers: While states purchase billions annually in concrete, cement, iron, and steel, and to a lesser extent fuels and petrochemicals, they are not the majority consumers when compared to the wider market. Given states’ limited purchasing power, private investment may choose not to invest in low-emission technology, which would limit the availability of low-emission products for states to purchase. If no alternatives exist, states will still need to purchase materials and will likely have to abandon embodied emissions standards.
- Need for robust EPDs: As reiterated throughout this report, verifiable and transparent third-party EPDs are critical. State procurement offers need to be able to compare different bids with different products on a like-for-like basis.
2.5. Long-Term Procurement Commitments
States can use mechanisms such as Advanced Market Commitments (AMCs), clean buyers’ groups, or multi- state procurements to organize private purchasers and developers and signal robust, long-term demand for low-emission products to the market. Collectively, these approaches help attract capital by providing certainty to technology developers and investors about reliable future demand for low-carbon products.
How and Where This Policy Has Worked
2.5.1. Advanced Market Commitments:
AMCs are a binding pledge by one or more customers to purchase a specified quantity of a future product that meets an agreed-upon performance criteria at a pre-set price. This mechanism reduces investment risk and encourages innovation without locking in specific technologies to get there. States could encourage major companies to form or join AMCs committing to future purchases of low- emission materials. This action would send a long-term investment signal, attracting the necessary capital for low-emission technologies, without requiring extensive state investment.
AMCs have seen considerable success in areas such as vaccine manufacturing, where governments andphilanthropic organizations committed to buying vaccines before they were commercially available, thus encouraging pharmaceutical manufacturers to take the risks necessary for development. In the materials sector, the World Economic Forum and U.S. State Department launched the First Movers Coalition, which focuses on getting large multinational technology, transportation, and energy companies to make low-emission purchase commitments for products such as steel and cement to create early demand for emerging technologies.
2.5.2 Clean Buyers’ Groups:
Clean buyers’ groups aggregate demand from organizations such as contractors or engineering, procurement, and construction (EPC) firms. Clean buyers’ groups, often comprising large contractors who work with federal, state, and private companies, are established in Europe. For example, the Climate Group organizes the Concrete and Steel Zero groups which include large multinational EPCs. A similar U.S.-based association could include major construction firms such as AECOM, Bechtel, and Fluor to signal strong demand for low-emission materials. This strategy would help attract private capital for low-emission products, even if those products come at a premium. Typically, the cost premium on low- emission materials is fairly small compared to the overall cost of the project. For example, the U.S. Department of Energy estimates that cement produced using 95 percent carbon capture would have a price premium of 20 to 40 percent.105 This translates to an increase in construction costs of less than one percent on average, since the material cost of cement accounts for less than 0.5 percent of typical project costs.106 This will vary based on the quantity of concrete used in projects. Similarly, the Federal Highway Administration’s (FHWA) Low Carbon Transportation Materials Program allocated $1.2 billion for low-carbon road construction materials over 7.5 years, which is only a 0.25 percent increase in annual spending.107,108
The FHWA’s Low Carbon Transportation Materials Program allocated $1.2 billion for low-emission road construction materials over 7.5 years, which is only a 0.25 percent increase in annual spending.
2.5.3. Multi-State Procurement: Multi-state procurements coordinate government purchasing across states to send strong, long-term market signals and help drive down costs. One recent example is the joint offshore wind procurement by Massachusetts, Rhode Island, and Connecticut in 2023. States could create similar multi-state procurement agreements for products such as cement, steel, and low-emission fuels. Multi-state procurement is effective at strengthening market signals but requires substantial state involvement to align goals internally across agencies and externally across states, as well as to negotiate and implement the procurement policy. The need to modify the steps involved in multiple state procurement processes increases the complexity of this policy and the time necessary to complete the procurement.
Together, these policies can serve as a technology- neutral pathway of using procurement and purchasing decisions to drive steady and patient capital into longer term low-emission industry technologies.
Implementation Strategies
| Policy Type | AMCs and clean buyers’ groups can benefit from direct state involvement. Likely administrative for state procurement offices to organize large purchasers and developers under existing authority, or with minimal new authority. Multi-state procurement would require legislative or administrative authorization, depending on the state. |
| Duration | Near-term adoption for AMCs and clean buyers’ groups; medium-term adoption for multi-state procurement; medium- to long-term impact for AMCs, clean buyers’ groups, and multi-state procurement. |
| Funding Required | Depends on the proportion of structural material costs to total construction budget. In the case that structural materials represent only a small fraction of overall project costs, even considerable cost increases may not drastically affect the total cost. Additionally, administrative support is needed to manage public funds, inform market suppliers about the program, align commitments with technological advances, and verify product standards. |
Policy Design Considerations
- Need for complementary policies: AMCs and clean buyer commitments may need to be paired with other policies that ensure low-emission alternative products are available.
- Setting the procurement target at an ambitious but achievable level: Setting the standard for low-emission materials procurement too low, under any of these programs, will fail to provide sufficient incentives for the necessary amount of capital to take advantage of these new markets. Setting the target too high can have a similar effect whereby entrepreneurs and companies see the standard as too high or unachievable and choose to invest elsewhere.
- Need to maintain market commitments over the long term: For all three mechanisms, there is a risk that if one or more parties to a procurement arrangement withdraw their individual commitment, then the whole arrangement may fall apart, reducing the market’s confidence and investment in emerging technologies. For instance, when Connecticut withdrew from the multi-state offshore wind procurement in 2024, it raised concerns about the deal’s viability, despite Massachusetts and Rhode Island’s continued support. Consistent demand signals are key to maintaining confidence and attracting investment.109
3. Enabling Action: Streamlined Regulations and Improved Standards
Streamlined regulations and clear standards help remove barriers and enable rapid industrial innovation. States are modernizing permitting processes, aligning standards with federal incentives, and clarifying compliance pathways to facilitate the timely adoption of low-emission technologies and ensure a level playing field for innovators and incumbents through the following types of policies.
- 3.1. State Siting and Permitting Reforms: States can streamline permitting and clarify siting responsibilities to reduce delays, attract investment, and minimize legal risk through transparent and coordinated processes.
- 3.2. Performance-Based Standards for Low-Emission Industrial Products: States can adopt performance- based material standards that prioritize outcomes over prescriptive inputs, enabling broader use of low-emission industrial materials.
- 3.3. Strengthened State Air Pollution Regulations: States can expand or update pollution regulations to cut harmful emissions, improve public health, and drive demand for low-emission technologies and products.
Extended Producer Responsibility for Industrial Products: States can require producers to manage products across their full lifecycle, incentivizing recycling, emissions tracking, and innovation while reducing public waste burdens.
Figure 5 identifies the industrial subsectors to which these approaches apply.
Figure 5: Regulatory policies for low-emission industry, with subsector mapping

3.1. State Siting and Permitting Reforms
Many low-emission industrial projects require dozens of permits from multiple state and local agencies, with authority often split or unclear between levels of government. This fragmented and overlapping process creates delays and uncertainty and discourages investment. Streamlining permitting can clarify responsibilities, reduce timelines, and make states more attractive locations for low-emission industrial development.
Sound siting and permitting decisions are important for several reasons. Straightforward and streamlined processes create certainty for businesses, whereas unclear processes, lack of communication between agencies, and insufficient staff can create delays. Effective planning and permitting signals that the state is an advantageous place to do business. For example, Texas has benefited from a rapid influx in renewable energy development over the last two decades largely due to the ease of permitting and proactive planning for building large-scale renewable projects. Permitting processes that are effectively executed and incorporate early and meaningful opportunities for public engagement can minimize legal risk such as stakeholder lawsuits. Transparent, clear, and legally defensible permitting are critical to minimize litigation risks.
Permitting takes place at all levels of government— local, state, tribal, and federal. Often there may be overlapping areas of jurisdiction, such as where linear infrastructure crosses state-managed and federally managed lands requiring both state and federal permits. While this report focuses on efforts that states can take to streamline their permitting and siting processes, reforms to federal environmental review and permitting processes are also under consideration.
How and Where This Policy Has Worked
Siting and permitting barriers take many forms—from differing local siting and zoning policies, and size, height, and acreage limitations on projects, to capacity limitations at relevant state and federal agencies. Likewise, state reforms can be comprehensive or more targeted. Below are key reforms states can undertake.
3.1.1. Establish a comprehensive state review of siting and permitting challenges
Given the diversity of state siting and permitting policies and challenges, states can start by empowering a select body or commission to study existing barriers and recommend legislative, regulatory, and administrative reforms to reduce barriers and timelines. For example, Massachusetts Governor Healey used an executive order to establish a Commission on Energy Infrastructure Siting and Permitting with the mandate to identify and remove barriers to energy development in the state.110 The commission convened a multi-sector group of stakeholders, conducted interviews, reviewed existing statute, and developed a report and recommendations in less than a year.
Massachusetts Governor Healey used an executive order to establish a Commission on Energy Infrastructure Siting and Permitting with the mandate to identify and remove barriers to energy development in the state. The commission convened a multi-sector group of stakeholders, conducted interviews, reviewed existing statute, and developed areport and recommendations in less than a year.
3.1.2. Establish one-stop state permitting offices
Administrative procedures are often slowed by process inefficiency, lack of coordination among authorities, unclear guidelines, and insufficient staffing at permit- granting authorities. To overcome these challenges, some states are considering one-stop permitting agencies that are empowered to review applications, request additional applicant information, consider site selection, coordinate community engagement, issue permits, and if needed and allowed by law, supersede local decisions. These authorities should have clear and consistent state statutory authority and be well resourced with expert staff to consider and permit applicants within mandated timelines. Some states, such as New York, have established renewable-energy-specific permitting authorities to speed the development and deployment of clean energy. Texas, Louisiana, Ohio, and Wyoming have implemented expedited permitting processes for CCUS projects, with policies ranging from streamlined Class VI well permitting to CO2 pipeline corridors and liability protections for storage sites. While not always branded as “one-stop permitting,” these tate-level initiatives function similarly by consolidating and accelerating the permitting process for specific industrial technologies. This approach could be applied to other types of industrial infrastructure investments.
Texas, Louisiana, Ohio, and Wyoming have implemented expedited permitting processes for CCUS projects, including streamlined Class VI well permitting, CO2 pipeline corridors, and liability protections for storage sites
3.1.3. Harmonized permitting:
Similar to recent federal reforms to the energy interconnection queue process,111 projects could be prioritized rather than permitted on a first-in, first-served basis. Such prioritization could first serve low-emission industrial projects ready to commence construction or perform clustered reviews of all permits for related projects. Industrial developers interested in building in a state would have to engage with the permitting department early and throughout the consultative process. Then, in developing their application, the permitting department would prioritize those applicants that have the most complete and ready project. Finally, a centralized permitting authority should strive to coordinate all relevant agencies and actors, set schedules, standardize requirements for projects of a certain size, and provide clarity and certainty to developers and other contributors on the permitting process.
3.1.4. Establish energy corridors and industrial development districts with reduced and streamlined permitting requirements:
Such zones would serve as predesignated areas in which the state, through a collaborative and public process, establishes that siting and permitting requirements will be eased and streamlined to spur speedy and necessary infrastructure investment. Energy corridors and industrial development districts could be preferred locations for projects because they are in strategic areas and can take advantage of existing infrastructure and rights-of-way, such as transmission lines, pipelines, and supportive facilities (e.g., roads, compressors, pump stations). Federal agencies have proposed such development zones, including Section 368 corridors and the National Interest Electric Transmission Corridors, which are currently being selected by the Department of Energy.112,113 Key benefits could include the following:
- Faster, more efficient permitting for energy projects
- Clear guidance for applicants on agency requirements
- Potential for infrastructure re-use and adaptation
- Streamlined environmental reviews and site assessment by focusing on site-specific studies
- Improved coordination among permitting agencies
- Eligibility for certain state or federal funding opportunities
States should consider stakeholder impacts in these zoning decisions and pair this reform with strategies to stimulate community engagement and benefits.
3.1.5. Community benefits and engagement:
Developers should set clear expectations for community benefits and engagement in all major projects, engaging communities early, openly communicating both positive and negative local impacts, and addressing community concerns in project design. States should support this process by offering technical assistance, developing engagement guidelines, and incentivizing or recommending strong community benefit criteria in permitting. Community benefits agreements can help ensure local communities share in project advantages such as jobs, training, infrastructure, and environmental protections.114,115 Project approval criteria should include evidence of early and ongoing outreach, analysis of local benefits, and clear accountability throughout the project. States can further assist by providing economic development grants and encouraging the use of external advisors to help communities participate fully. Flexible frameworks should be used to tailor benefits and engagement strategies to local needs, rather than a one- size-fits-all approach.
3.1.6. Establish or expand existing port authorities for infrastructure:
Large-scale industrial infrastructure such as crackers at refineries, iron and steel smelters, and cement kilns require access to transportation infrastructure such as ports and railroads. Additionally, these facilities create industrial ecosystem benefits when they cluster together, allowing numerous industries and companies to shoulder the expense of building and maintaining large-scale infrastructure. This is true for low-emission infrastructure as well, particularly CO2 and hydrogen pipelines. Port authorities are government-owned or quasi-government agencies that own, operate, and invest in shared infrastructure relied on by private enterprises such as shipping, liquified natural gas and offshore drilling, and manufacturing companies. The Houston Port Authority, for example, is the largest port in the United States.
There are dozens of multinational energy, steel, and chemical companies within the footprint of the port authority. Port authorities can leverage these industrial ecosystems to invest and build shared infrastructure such as CO2 and hydrogen pipeline networks to help industries reduce emissions. Additionally, given the highly industrialized nature of port authorities, siting and permitting challenges are likely to be minimal. States that already have robust and established authorities should instruct the respective governing bodies to develop a low-emission industrial action plan that can coordinate and invest in necessary infrastructure.
3.1.7. Substantive approval requirement relaxation:
The substantive approval requirement ensures that projects meet all underlying legal and technical standards before and during operation. This is enforced through detailed application requirements, agency review, and ongoing compliance mechanisms. Some legislative and regulatory reforms have shifted toward objective, standards-based approval frameworks to reduce discretionary hurdles without reducing substantive protections. For example, Oregon’s Plant Site Emissions Limit Program grants manufacturing facilities flexibility to modify operations or make process changes as long as the plant site remains within its overall air emissions cap. This means companies do not need to seek new permits or notify environmental regulators for every equipment or process alteration, provided they stay within the established emissions limits. Wyoming’s permitting process for mining and geothermal projects uses a hybrid model in which state agencies pre-certify projects that meet air and water quality benchmarks, while local governments retain authority over land use and localized concerns.
Oregon’s Plant Site Emissions Limit Program grants manufacturing facilities flexibility to modify operations or make process changes as long as the plant site remains within its overall air emissions cap.
3.1.8. Agency review capacity enhancements:
Jurisdictions are addressing staffing shortages and expertise gaps through dedicated funding mechanisms and process automation. These initiatives strengthen permitting agencies’ ability to process applications efficiently by increasing staff expertise, improving interagency coordination, and leveraging technology such as AI-powered automation to streamline reviews. For example, Virginia’s Executive Order 39 (2024) directs state agencies to further streamline and digitize the permitting and licensing process by bringing more permit types onto the Virginia Permit Transparency (VPT) online platform, eliminating obsolete approvals, and improving processing times and user experience across multiple agencies.
3.1.9. Industry application preparedness initiatives:
States can equip industry applicants with resources and support to ensure complete and accurate permit submissions, thereby reducing delays and streamlining reviews. State agencies implement measures such as custom checklists, pre-application consultations, and targeted training programs for the industrial sector.
Implementation Strategies
| Policy Type | Legislative and administrative. The policies detailed here would require substantial attention and action across all levels of state and local government, including from the governor/ agencies, legislature, and local officials. Community support and state-federal coordination also are critical. |
| Duration | Medium-term adoption; medium- to long-term impact. |
| Funding Required | Moderate funding needed. All these efforts to reduce regulatory barriers require trained and experienced state staff to implement new programs. Permitting and user fees can completely or partially offset funding needs. |
Policy Design Considerations
- Local pushback and community resistance: Local jurisdictions that have exclusive or shared siting and permitting authority with states will likely hesitate to give up local control and decision-making in permitting and planning decisions. States can partially address these efforts by sharing authority with local authorities and ensuring that any preemption of local authority will only be used in limited circumstances after a robust process has been completed or repeated and after persistent denials or failure to act on permits from local authorities jeopardizes state investment. Some communities are opposed to any kind of infrastructure investment and buildout. States can alleviate some of these concerns through early and frequent community stakeholder engagement, correcting misinformation, highlighting both the economic and local environmental benefits that projects may bring, and working to ensure that project developers address legitimate community concerns.
- Coordinating with existing state land-use and environmental laws: Streamlined permitting will need to navigate existing land-use and environmental laws at the local, state, and federal levels and remove disincentives for adopting new technologies. Some states, such as California, have their own environmental policy act which can be stricter than federal National Environmental Policy Act requirements. Additionally, almost every state and local jurisdiction has its own zoning ordinances and permitting processes. Any effort to streamline industrial permitting would likely have to rationalize across conflicting land-use and environmental laws. A comprehensive state permitting roadmap or commission, as noted above, could find the areas where state and local laws are hindering development and propose reforms.
- Staffing and technical assistance: State staff are required to process and screen applications for completion, request additional information, and ensure that the permits and permit review process meets all statutory requirements. Otherwise, an improperly vetted application poses a potential legal risk that would delay or cancel the project. Currently, with ongoing efforts at downsizing state and federal workforces, permitting may become more of a challenge. States should invest in their permitting workforce given the beneficial economic development outcomes and need to be competitive with other states on industrial development. States can use permitting fees and other funding mechanisms to support right-sized staffing levels.
CASE STUDY 2: LOUISIANA
Louisiana Carbon Capture Utilization and Storage: Comprehensive State Legislative Support
Overview
Louisiana has a range of state legislative and permitting policy support to spur increased private investment in carbon capture utilization and storage (CCUS) technologies. At the center is state regulatory primacy over Class VI underground CO2 injection wells, received from EPA in 2024. As a result, in the 2024 legislative session, the state passed several laws to spur greater CCUS investment and development through eased permitting and siting requirements, as well as through revised regulation around eminent domain and landowner and pipeline operator liability. However, in Louisiana’s 2025 legislative session, many bills were proposed that could have restricted CCUS, such as local control authority, removal of eminent domain for pipelines, raising the unitization threshold, and increased notice and safety requirements. Though many of these bills failed in the legislature, they point to the need for greater education and transparency to build public understanding and trust.
2024 Legislative Policy Portfolio
HB 169: Limits non-economic compensatory damages in civil suits against storage facility owners, CO₂ pipeline operators, or carbon generators to $250,000 per person, instead of per occurrence. In wrongful death or severe injury cases, the cap increases to $500,000 per person.
HB 492: Grants eminent domain authority to CO₂ pipeline developers for underground storage, while revoking such rights for geologic storage.
HB 516: Establishes standards for CO₂ sequestration, covering emergency preparedness, siting, groundwater monitoring, and required local filings.
HB 937: Gives limited liability protection to landowners hosting CCS operations.
HB 966: Authorizes and outlines the unitization process for CO₂ storage projects.
Policy Rationale and Critique
- Louisiana is a major chemical and petrochemical refining hub, located near robust underground geological storage sites for CO2 sequestration.
- The state also has one of the most interconnected pipeline networks in the country with close to 50,000 miles.
- With Class VI CO2 sequestration primacy, Louisiana seeks to become a CCUS industrial leader by matching industry ambition with streamlined CO2 pipeline and storage regulations.
- Issues regarding local control, technology safety and oversight, and property rights remain barriers to project deployment.
- Assignment of long-term liability to the state creates a liability gap, given state sovereign immunity.
Industry and Community Response
- The most affected industries are chemicals, including hydrogen and ammonia, and petroleum refining.
- Industry has announced more CCUS projects and CO2 pipeline development in Louisiana than in any other state.
- Companies are planning billions of dollars in low-carbon CCUS industrial investment.
- Local pushback to CO2 sequestration pipelines and injection sites may require more concerted community engagement, education, and transparency during project development.
Impacts
- 104 individual Class VI well applications
- $23 billion in announced investments
- 4,500 new jobs projected
- 33 Class VI distinct storage projects proposed
Case study citations provided in Appendix D
3.1. Performance-Based Standards for Low-Emission Industrial Products
Within each state, standards govern what types of building materials can be used in different construction applications (e.g., bridges, buildings). Standards-setting organizations such as ASTM International develop technical standards for different building materials, and state agencies, such as state building code agencies or commissions and state departments of transportation, then decide which version of the standards to adopt for each material and application within the state. ASTM standards are referenced in model building codes (e.g., International Building Code) and state-specific construction codes, making them binding for all projects subject to these codes and not only to government construction projects.
To facilitate more widespread use of materials produced using low-emission processes, states can move from prescriptive- to performance-based standards. Performance-based material standards focus on defining material performance requirements such as strength, durability, and corrosion resistance, without prescribing exactly how the products are made. This approach contrasts with traditional prescriptive standards, which dictate exact formulations and proportions for products (e.g., water content in concrete or recycled content in steel). Prescriptive standards can present a barrier to low-emission products that perform equally well or better than their traditional counterparts but that are produced using processes that do not align with the requirements of the prescriptive standard. By emphasizing outcomes over inputs, performance-based standards allow for more flexibility in what building materials can be used, creating room for the adoption of low-emission alternatives. Adoption of performance-based standards for construction materials remains low but is gradually expanding from cement into other construction material sectors.
How and Where This Policy Has Worked
State agencies would set specific performance requirements based on a product’s intended use. For example, structural concrete for highways may have higher durability and strength requirements than sidewalk concrete. Suppliers can use less emission- intensive alternatives, such as cement with higher quantities of supplementary cementitious materials (SCM) that are less carbon-intensive but have the same or greater physical properties.
Performance-based standards have primarily been used in the cement and concrete industries. Despite the introduction of a performance-based concrete standard by ASTM in 1992, adoption by states has been slow.116 A 2022 survey found only 7 out of 36 state transportation departments had incorporated performance-based specifications in their concrete standards. However, as states seek to reduce material emissions while ensuring safety and reliability, performance-based standards offer a technology-neutral way to advance alternatives. While performance-based standards are beginning to gain traction in the cement industry, they have received less attention in the iron, steel, and chemical industries. In sectors with more homogeneous products, such as iron and steel, performance-based standards may have less impact in shifting toward lower-emission processes.
Implementation Strategies
| Policy Type | Administrative action, in collaboration with third-party industrial partners and codes and standards organizations. |
| Duration | Long-term adoption and impact. Transitioning from prescriptive to performance-based standards would signal a fundamental market shift in how materials are evaluated in public contracts based on developed and approved product codes and standards. |
| Funding Required | Modest funding for workforce training and technical assistance to support the transition and to support testing and validation equipment and assistance. |
Policy Design Considerations
- Risk aversion and comfort with existing standards: State transportation and procurement departments are often risk-averse, preferring established prescriptive standards to newer performance-based ones. Concerns about safety, durability, and infrastructure performance can make states hesitant to adopt performance-based standards, even if the new standards support emissions reduction and result in better product outcomes.
- Technical assistance and workforce training: Transitioning to performance-based standards requires extensive training for contractors, engineers, and inspectors. Many agencies lack the resources and programs needed to implement and verify new formulations under these standards. Additionally, testing and modeling equipment are essential to ensure that products meet safety requirements, but many state departments and contractors lack access these resources.
- Industry resistance: Industries may resist changes due to alterations in supply chains and the need for new quality assurance processes. Ensuring that new materials meet performance criteria in diverse environmental conditions presents technical challenges that require extensive research and validation.
- No “one-size-fits-all” approach: Performance standards may work better for certain products, such as concrete and cement, than for more homogeneous products such as ammonia and fertilizer. However, states purchase considerable volumes of cement and steel and tend to buy fewer upstream chemicals, making performance standards less applicable in those sectors.
3.3. Regulations
Robust environmental regulations can ensure that industrial emissions reduction efforts also address conventional air pollution that impacts public health and the environment. Many states have substantial authority to regulate air pollution beyond federal minimums, including GHGs, criteria air pollutants, and hazardous air pollutants, although some are constrained not to go beyond federal standards.117 Where this authority is available, it can be exercised through state implementation plans (SIPs), direct emissions standards, permitting, and rulemaking, and it can be expanded through new legislation, regulatory updates, or collaboration with the U.S. EPA.118,119,120,121 For example, states could enable their permitting agencies to consider electrification and other low-emission process changes as appropriate control technologies during the permitting process for new and modified facilities— options that are often overlooked or deprioritized under current EPA permitting practices and guidance.122
Modernizing pollution regulations can enhance economic competitiveness, and emphasizing the health benefits of cleaner air and reduced pollution can build broad public backing, especially in communities most affected by industrial emissions. Market-based approaches, such as cap-and-trade or flexible compliance mechanisms, provide both regulatory certainty and economic efficiency. Strong standards can also drive demand for pollution control and low- emission manufacturing technologies, supporting high-quality jobs and local supply chains. Finally, states with robust regulations can gain a competitive edge by attracting investment from buyers seeking low-emission products, positioning themselves for success as markets increasingly value cleaner goods.
How and Where This Policy Has Worked
State authority to strengthen pollution regulations spans several approaches:
- Setting standards stricter than those required by the Clean Air Act, such as New Source Performance
- Standards, section 111(d) existing source standard, or stricter application of New Source Review programs Regulating GHGs from industrial sources, including through direct limits, cap-and-trade programs, or carbon taxes
- Requiring advanced pollution controls and monitoring as part of state permitting
- Addressing cumulative impacts in overburdened neighborhoods through targeted provisions for areas with a high concentration of industrial activity
States across the political spectrum have adopted stronger regulatory measures to address industrial pollution, often driven by local health impacts, public demand, or the need to comply with federal standards:
- Colorado: Adopted direct GHG emissions caps for major industrial sectors and strengthened permitting requirements for air toxics and criteria pollutants123
- Louisiana: Implemented more rigorous air toxics monitoring and reporting requirements for petrochemical facilities in response to community health concerns124
- Texas: Used SIP authority to require additional controls on ozone precursors in the Houston-Galveston area, targeting emissions from refineries and chemical plants125
- New Jersey: Enacted cumulative impacts legislation requiring enhanced review and possible permit denial for new or expanded facilities in overburdened communities, strengthening hazardous air pollutant controls126
- California: Implemented the Cap-and-Trade Program that levies a carbon price on large industrial emitters and uses auction revenues to fund emissions reduction projects, including in disadvantaged communities127
Implementation Strategies
| Policy Type | Legislative and administrative. State regulatory authority can be expanded through legislation, rulemaking, partnership with EPA, or regional programs. State legislatures can allow or even mandate new or more stringent pollutant standards, update permitting processes, require cumulative impact analysis, or authorize market-based mechanisms. Some state environmental agencies can adopt tighter emissions or technology standards under existing authority. States may work with EPA to implement federal programs with state-specific enhancements. States can join or initiate multi-state efforts (e.g., cap-and-trade policies) to address cross- border pollution and carbon leakage. |
| Duration | Near-term adoption; medium- to long-term impact. |
| Funding Required | Modest; increased funding for state environmental agencies to cover rule development, permitting, compliance monitoring, enforcement, technical staffing, and stakeholder engagement, with costs varying based on the scope and rigor of the new regulations. |
CASE STUDY 3: LOUISIANA
Colorado Industrial Policies Portfolio: A Multifaceted Approach to Decarbonization
Overview
Colorado established a comprehensive portfolio of emissions reduction policies to reduce pollution and boost economic competitiveness. The effort began with HB 19-1261 in 2019, which set binding statewide GHG reduction targets and required regulators to address industrial emissions. A sector-specific roadmap and the 2021 Environmental Justice Act followed, mandating a 20% cut in industrial GHG emissions by 2030. Through phased rulemaking, including the 2023 GEMM 2 rule, Colorado expanded direct regulation of large industrial facilities, while ongoing legislative, executive, and stakeholder support ensured the portfolio’s durability and alignment with economic strategies.
Policy Portfolio
The Colorado Industrial Tax Credit Offering provides
$168 million in refundable tax credits through competitive, semi-annual funding cycles for industrial facilities that implement emissions reduction projects, focused on high-impact efforts.
The Carbon Management Roadmap, released in February 2025 with input from 15 state agencies, outlines nearly 70 policy recommendations and guides sector- specific strategies for decarbonization.
Industrial Electrification Initiatives offer targeted programs to help industries transition from fossil fuels to renewable electricity, focusing on sectors with the greatest near-term emissions reduction potential, such as beer, container glass, and beet sugar.
Technical Assistance Programs supply resources and expert guidance to help facilities identify, plan, and execute projects.
Regulatory baselines require the 18 highest-emitting industrial facilities to collectively reduce emissions by 20% by 2030 compared to 2015 levels, ensuring measurable progress.
Policy Rationale
- Targets at least a 20% cut in industrial emissions by 2030 and net-zero by 2050.
- Promotes energy efficiency and electrification to lower emissions and energy costs.
- Uses incentives, technical assistance, and regulations to drive low-emission technology adoption.
- Supports job creation, industrial competitiveness, and innovation.
- Prioritizes pollution reductions in impacted communities and economic opportunities.
- Combines emissions reduction with economic growth and stakeholder engagement for broad political support.
- Leverages federal funding to maximize support and accountability.
Industry Response
- The most affected industries are cement, steel, chemicals, food and beverage processing, petroleum refining, and advanced manufacturing.
- These sectors have participated in policy development through public comment, stakeholder meetings, and regulatory hearings.
- Industry responses have included concerns about compliance costs and timelines, requests for flexible mechanisms, and calls for phased implementation.
- Some companies have engaged in pilot projects and used incentives, while others remain cautious but involved in ongoing dialogue with state agencies.
Impacts
- 4,900 new jobs in clean energy and industry (2022-2024)
- 20.0% decrease in industrial GHG emissions (2019–2023)
- $1.7 billion in clean energy and industrial project announcements (2022-2024)
Case study citations provided in Appendix D
Policy Design Considerations
- Legal uncertainty: Recent federal court decisions, such as West Virginia v. EPA, 597 U.S. 697 (2022), have raised questions about the permissible forms and potential stringency of federal GHG regulation, yet many states still retain authority to regulate GHGs.
- Potential for leakage: Stricter state regulations in one state can raise costs for local industries there, creating the risk of “leakage” as businesses shift operations to other states with weaker standards; however, states can address this challenge with phased implementation, targeted support, or regional agreements.
3.4. Extended Producer Responsibility for Industrial Products
Extended Producer Responsibility (EPR) is a state- or local-level policy that holds producers accountable for the entire lifecycle of their products, including end-of-life disposal. In place for over two decades, EPR programs exist in 35 states and cover as many as 18 product categories.128 EPR policies are enforced through state laws that require producers to:
- Register products with state agencies and pay fees to fund recycling infrastructure;
- Track material flows using standardized reporting tools (e.g., digital product passports, third-party audits) to verify recycling rates and emissions reductions; and
- Fund or operate take-back programs, such as deposit- return systems, to ensure products are diverted from landfills.
Regulators may impose fines, product bans, or restrict market access as penalty for non-compliance. Such policies also promote innovation by incentivizing manufacturers to reduce hazardous content and lower the environmental impact of their products and packaging. By shifting the financial burden of waste management from state and local governments to producers, EPR programs can help reduce public waste management costs.
How and Where This Policy Has Worked
There are many examples of successful EPR programs for different end-use products in the United States and elsewhere. In the U.S., EPR programs are commonly applied to specific product types, especially electronic waste. E-waste laws are active in 24 states and typically require producers to collect deposits and manage end-of- life recycling and disposal programs to ensure that toxic materials do not end up in municipal landfills. Over the past decade, EPR programs have expanded to include batteries, paints, pharmaceuticals, and, more recently, packaging. Packaging EPR laws make producers—such as brand owners, licensees, manufacturers, and in some cases franchisors—responsible for waste from single-use packaging, food packaging and ware, and paper products. California, Colorado, Maine, Minnesota, and Oregon have enacted such legislation, while many other states are considering similar expanding EPR programs. EPR programs are also beginning to cover new product categories such as chemicals and plastic packaging. These programs typically involve product registration, deposit collection, labeling and reporting requirements, and end-of-life recycling. Non-compliance can result in considerable penalties.
California, Colorado, Maine, Minnesota, and Oregon have enacted [packaging EPR] legislation, while many other states are considering similar expanding EPR programs.
States could expand upon existing EPR programs or grant localities the ability to set up their own programs for new products. EPR programs probably would work best for plastics and other basic petrochemicals products. Because iron, steel, and cement are longer- lasting products that are likely to be integrated into a final end-use product such as a building, bridge, or road, it could be harder to hold the original producer responsible for its end-of-use management. With products such as single-use plastic that rely on upstream petrochemicals and are typically not in circulation for long, state EPR programs could require that the producers of either the end-use product or the plastics manufacturer take action to ensure that their products do not end up in state and municipal landfills. EPR programs should be phased in slowly over time with increasing benchmarks that require manufacturers to either avoid or divert a certain amount of total production from landfills and other end-of-life solutions.
When done properly, EPR programs can spur private research and development on new emissions reduction strategies that allow for end-use products to be reused or recycled more easily or turned into other useful products. For example, there is evidence to suggest that EPR programs have advanced the production of new biodegradable packaging materials and food service ware that safely dissolves in water.129
Additionally, EPR programs can create local jobs through enhanced waste management, reduce municipal waste management budgets by shifting the responsibility from the end-use consumer to the producer, and reduce upstream emissions from decreased product use. By shifting these costs to the producer and manufacturer, EPR programs encourage producers and manufacturers to take innovative steps to reduce plastic use and pollution and to invest in smart solutions to avoid end-use costs.
Implementation Strategies
| Policy Type | Legislative to enact state- wide waste management policy or allow jurisdictions to establish more ambitious EPR programs in their jurisdictions. |
| Duration | Near-term adoption; medium- to long-term impact. EPR programs rely on policy certainty to signal to the market that robust investment in technology to track and manage product streams after they leave the factory will be required. Policy flip-flopping or overly complex or generous exemptions would likely undermine any EPR program. |
| Funding Required | Modest; funding is likely to be supported through producer fees and other forms of producer deposits for compliance. States and localities can reduce their overall waste management budgets if producers now shoulder some of the burden of tracking and disposing of products through their useful end-of-life. |
Policy Design Considerations
- Technical and cost barriers: Manufacturers and producers of petrochemicals, such as plastic precursors, could pay more attention to what happens after raw materials are manufactured into useful products. With an EPR program, these upstream producers will face increased regulatory and technological costs to comply. Given the wider industry experience with EPR programs and the robust literature on state programs, these costs are likely manageable and could even increase the competitiveness of producers as consumers begin to demand more sustainable products. Additionally, phasing these EPR programs in at low levels and building to more ambitious standards can give producers time to innovate new products.
- Need to avoid false recycling or waste-to-energy options: EPR programs are not just expanded recycling programs. Rather, they require producers to take ultimate responsibility for their products through their useful end of life and to design products that will not just be landfilled or combusted in waste-to-energy designs. Waste-to-energy stations are typically located in poor and environmentally burdened neighborhoods and are often linked to adverse air pollution and human health. EPR programs should not credit or lead to increased waste-to-energy reliance.
- Interstate commerce and out-of-state concerns: State or local EPR programs potentially face two types of constraints under federal law. First, Congress could preempt state laws—perhaps as part of enacting a nationwide EPR bill—but has not done so yet. Second, producers might argue that EPR programs violate the dormant Commerce Clause, which prohibits state or local law that unduly burden or discriminate against interstate commerce. However, no court has struck down an EPR law on this basis, and in 2014, the Ninth Circuit Court of Appeals upheld the Alameda County Safe Drug Disposal Ordinance, which required drug manufacturers to operate and finance a program to collect and dispose of unwanted pharmaceuticals, against a dormant Commerce Clause challenge. Pharm. Research & Mfrs. of Am. v. Cty. of Alameda, 768 F.3d 1037, 1040 (9th Cir. 2014). Additionally, if most of a producer’s end-use product ends up out of state in other upstream manufactured products, it can be difficult for the state program to enforce EPR requirements on those in-state producers.
- Need to improve product transparency and end-of-life tracking: For upstream producers, states, and cities to establish effective EPR programs that include responsibilities for product management, they need to understand material composition and disposal through their end-use life cycle. This requires transparency regarding the types of materials in products, such as through recycling symbols or product codes. Additionally, state programs should develop mechanisms to track a product’s journey from its end use to its disposal, enabling states or municipalities to identify the responsible party at the product’s end of its useful life.
4. Data, Monitoring, Compliance, and Stakeholder Engagement: Foundations for Effective State Industrial Innovation Policy
Robust state industrial innovation policy relies on a strong foundation of data collection, performance monitoring, compliance mechanisms, and stakeholder engagement. These elements are essential for public trust, informed decision-making, effective implementation, and continuous improvement as states seek to modernize heavy industry.
4.1. The Critical Role of Data and Monitoring
Accurate, consistent, and timely data are the backbone of effective policy. State action is increasingly valuable given current threats to federal data collection and reporting. Establishing clear metrics and standardized reporting frameworks across agencies and industrial operators will enable states to perform multiple key responsibilities:
- Monitor progress toward innovation and emissions reduction targets
- Identify gaps and emerging challenges in policy implementation
- Evaluate the effectiveness of current strategies and adjust as needed
- Ensure transparency and build public trust in state-led initiatives
States should consider legislative or regulatory actions to require regular data submission from industrial facilities, utilities, and relevant agencies. Interagency collaboration and, where appropriate, partnerships with local governments and research institutions can further enhance data quality and accessibility. Periodic review of key metrics—such as emissions intensity, energy consumption, and technology deployment—will help states stay on track and refine their approaches over time.
4.2. Ensuring Compliance and Accountability
Effective compliance mechanisms ensure that low- emission industry policies achieve their intended outcomes. States should establish clear standards and requirements for emissions reporting, technology performance, and environmental outcomes.
This may include the following:
- Emissions and performance reporting for regulated facilities
- Third-party verification of reported data and EPDs
- Regular audits and spot checks to ensure data integrity
- Enforcement provisions, including penalties for non-compliance
By embedding compliance requirements into permitting, procurement, and incentive programs, states can create a level playing field and reinforce the credibility of their low-emission industry efforts.
4.3. Stakeholder Engagement for Policy Success
Engaging a broad spectrum of stakeholders— including industry leaders, labor, community groups, environmental advocates, and regulatory agencies— is vital for designing and implementing policies that are both ambitious and practical. Early and ongoing stakeholder engagement helps achieve several goals:
- Surface operational realities and technical constraints faced by industry
- Build consensus around policy goals and implementation pathways
- Identify and address community considerations, ensuring that benefits and burdens are shared fairly
- Foster buy-in and reduce resistance to change
States can formalize stakeholder engagement through advisory councils, working groups, and regular public consultations. Involving stakeholders in setting targets, tracking progress, and refining policies ensures that state actions align with both economic and community needs, while also providing a platform for continuous feedback and improvement.
4.4. Integrating Data, Compliance, and Engagement for Innovation
The interplay among data, compliance, and stakeholder engagement creates a robust foundation for fostering innovation. Reliable data enables transparent monitoring and accountability, while compliance mechanisms ensure that all actors meet their obligations.
Stakeholder engagement, in turn, brings diverse perspectives to the table, helping to identify practical solutions and future-proof policies against evolving technological and market conditions.
SE C TION 5
Conclusion
U.S. industry is both a foundational pillar of state economies and a leading source of air pollution, accounting for nearly a quarter of national GHGs and substantial criteria air pollutants. Modernizing this sector is essential for economic growth, community health, and environmental leadership. States have a unique opportunity to accelerate this transformation by deploying a balanced portfolio of financial incentives, market-based mechanisms, and regulatory approaches, paired with robust monitoring, compliance mechanisms, and meaningful stakeholder engagement. The following conclusions synthesize key findings across these primary policy domains, highlighting robust data collection, monitoring, compliance mechanisms, and meaningful stakeholder engagement as cross-cutting policies essential to the effectiveness of all state-level low- emission industry policies.
Driving Innovation: Financial Support
Financial incentives are critical to overcoming upfront cost barriers and investment risks inherent with developing and deploying new technologies. States can employ several tools, such as tax incentives, targeted support for lower-TRL technologies, pilots and demonstrations, and strategic support by state agencies. When well-designed, these incentives can unlock private investment and help de-risk emerging technologies. To ensure public funds generate meaningful outcomes, financial incentives should be accompanied by robust monitoring systems that track their effectiveness.
Stimulating Demand: Low-Emission Markets
Market-based mechanisms are essential to building demand for low-emission industrial products and technologies. Environmental product declarations (EPDs) form the foundation of many procurement policies by providing transparent, standardized emissions data. Policies, such as preferential bidding, contracts for difference, material emissions standards, and long-term procurement commitments, allow states to leverage their purchasing power and offer market certainty that accelerates adoption. These tools reduce investment risk and drive technological learning but require careful design to avoid excessive public costs or market distortions.
Enabling Action: Streamlined Regulations and Improved Standards
Regulatory policies can remove barriers and provide clarity to accelerate industrial emissions reduction. For example, streamlined permitting and clarified siting responsibilities can reduce project delays, attract investment, and minimize legal risk. States can also adopt standards—such as performance-based product requirements, extended producer responsibility, or air pollution limits—that set clear thresholds for emissions or product performance. When aligned with financial and market-based tools, well-designed regulations can drive emissions reduction, improve public health, and ensure long-term accountability.
Sector-Specific Policy Synergies
The four analyzed industrial subsectors—cement, iron and steel, petroleum refining, and chemicals—require tailored policy approaches due to differences in production processes, temperature demands, emissions sources, and product specifications. Table 8 below outlines the technologies and key policies best suited to each sector.
Integrated Policy Design for States Leadership
No single policy is sufficient to transform the industrial sector. The most effective state strategies will accomplish multiple objectives:
- Combine financial incentives to spur innovation, market-based approaches to build demand and de- risk investment, and regulatory measures to set clear standards and ensure accountability.
- Tailor policies to the unique industrial and legal landscape, workforce, and economic priorities of each state.
- Engage communities early and often to ensure fair distribution of benefits and transparent communication.
- Coordinate policy development with available federal funding to leverage technical and financial support and align policies with the growing global market demand to accelerate investment and expand market opportunities.
By adopting a comprehensive, balanced approach across financial, market, and regulatory policy domains, states can position themselves as national leaders in low-emission industry—delivering economic growth, good jobs, and healthier communities while meeting environmental goals. The rise of low-emission global markets and federal incentives creates an unprecedented opportunity for states to future-proof their industrial base and secure long-term competitiveness.
Table 8: Key policies and technologies for industrial subsectors
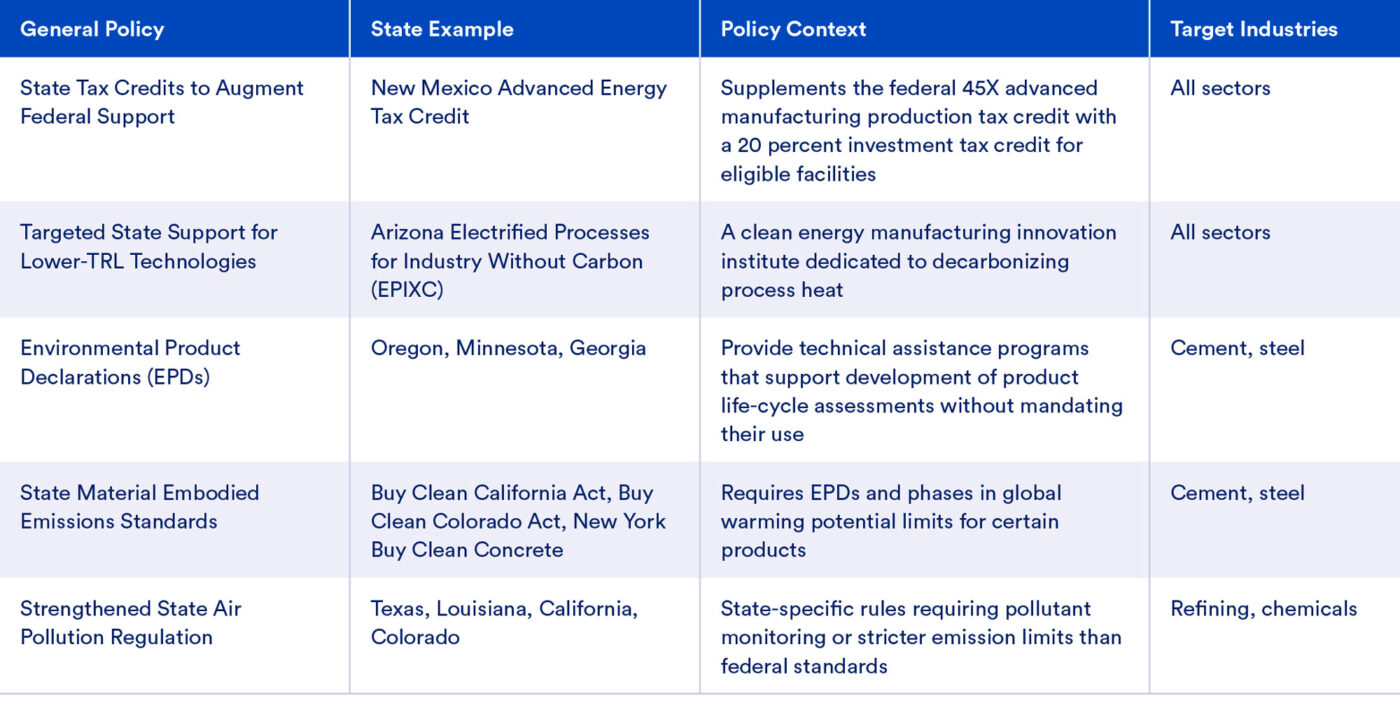
APPENDIX A
Subsector One-Page Overviews
APPENDIX B
Technology Pathways – Subsector Detail
Process Electrification
Petroleum Refining
Electrifying petroleum-refining processes poses substantial challenges due to the sector’s reliance on continuous, high-temperature operations (often exceeding 500°C) for distillation, cracking, and reforming. While low- and medium- temperature processes, such as water and air preheating, can be partially electrified using mature technologies such as industrial heat pumps or electric boilers (TRL 9), full electrification of core refining units remains a longer-term prospect. Emerging technologies, including resistive and induction heating, are being explored for high-heat applications but currently remain at TRLs of 4–6, with limited commercial pilots. Retrofitting refineries with electric systems would require substantial redesign and grid upgrades, making near-term progress dependent on hybrid approaches or electrification of auxiliary systems. As the grid decarbonizes and electric heating technologies mature, electrification could provide a scalable pathway to reduce emissions from refining operations over the longer term.130,131,132
Chemical Manufacturing
Electrification efforts within chemical manufacturing are primarily focused on the steam cracking process, which is among the most energy-intensive operations in the industry. Traditional steam crackers rely on fossil combustion to reach temperatures around 850°C to break down hydrocarbons into ethylene, propylene, and other base chemicals. New electric steam crackers, powered by renewable electricity and capable of reaching these high temperatures through resistive or induction heating, are being piloted in Europe and the United States, with current TRLs around 6–7. BASF, SABIC, and Linde collaborated on the world’s first electric steam cracker demonstration plant, which began operation in Germany in 2024.133 U.S.-based projects are still in earlier development stages, with companies including Chevron Phillips, LyondellBasell, Shell, and Dow all planning their own electric cracking demonstration plants to be operational in the latter-half of the decade.134,135
Partial electrification of lower-temperature processes such as drying, separation, and preheating is already commercially viable and can deliver incremental emissions reductions in the near term.136 As electric cracker demonstrations scale and infrastructure develops, electrification could substantially reduce combustion-related emissions across the sector, especially in facilities where grid access and process integration are feasible.
Cement Manufacturing
Electrifying cement kilns is technically challenging due to the high-temperature requirements (~1450°C) of the clinker production process. While electric kilns and plasma heating are being explored, they remain at low TRLs and face economic and infrastructure hurdles, including the need for high-voltage connections and thermal storage. Partial electrification of lower-temperature processes, such as preheating, is closer to technical feasibility and may serve as a transitional application. For the cement sector, DOE estimates these technologies have an unconstrained emissions abatement potential of up to 35 percent compared to business as usual and classifies these technologies with a TRL of 5–6, with electric precalciners representing the higher end of the TRL range due to its lower temperature requirement compared to electric kilns.137,138 Examples of ongoing projects include two Finland-based companies: VTT Decarbonate’s novel electric rotary kiln prototype, unveiled in 2022, and Coolbrook’s industrial-scale pilot currently under construction.139,140 Successful demonstration of these electric kilns would bring the TRL for this emerging pathway up to level 8 or 9.
Iron and Steel Manufacturing
Electric Arc Furnace (EAF) steelmaking is a mature, commercially deployed technology (TRL 9) that plays a central role in reducing emissions from the steel industry. Unlike traditional blast furnace production, EAFs use high-current electric arcs to melt recycled steel scrap and direct reduced iron (DRI), substantially reducing CO₂ emissions by up to 75–80 percent, especially when powered by renewable electricity. EAFs are more flexible and cost-effective to build than blast furnaces, making them attractive for both new installations and retrofits. However, their effectiveness depends on the availability of high-quality scrap and affordable clean electricity. In the United States, EAFs already account for about 70 percent of steel production, positioning the country as a global leader in low-carbon steel. While EAF capacity continues to expand, high-quality steel products will continue to require ore-based metallics (OBM) such as pig iron and DRI. BF-BOF facilities can continue to produce OBMs with reduced emissions by transitioning blast furnaces to DRI technologies by installing a submerged arc furnace (SAF) or electric melt furnace (EMF). These electrically-powered furnaces take solid iron from a direct reduction iron plant and melt it into liquid iron, which can then be used in a basic oxygen furnace (BOF) in a manner similar to how hot metal is used from a blast furnace.141 Transitioning blast furnaces and existing DRI processes to hydrogen- based DRI processes are key strategies for further emissions reductions in primary steelmaking.142,143
Carbon Capture, Utilization, and Storage
Petroleum Refining and Chemical Manufacturing
CCUS is critical for decarbonizing petroleum refineries and chemical manufacturing. These industries have CO2 emissions which stem from the processing of fossil-based feedstocks and fuels which emit CO2 through combustion and chemical reactions. Examples include steam methane reforming (SMR) for hydrogen production at ammonia and refining facilities as well as fluid catalytic crackers (FCC) which generate CO2 from process heaters and catalyst regeneration. SMR can reduce emissions using both pre- and post-combustion capture, while FCC flue gases are well suited for amine- based capture, a mature technology with a TRL of 9.144 Refineries also produce off-gases which are typically used as fuel for other processes; these can alternatively be converted to hydrogen using an autothermal reformer coupled with CCUS.145 CCUS is particularly relevant for high-emitting commodity chemicals such as ammonia, methanol, and ethylene, where carbon capture can be integrated at reformers or fired heaters. Ammonia plants already incorporate a CO2 capture step following methane reforming, but the resulting CO2 is either vented or used for urea production. Commercial demonstrations of CCUS in a refinery context include Shell’s Quest project in Alberta, which captures over 1 million tonnes of CO2 annually from hydrogen production at a refinery, and Air Products’ facility in Port Arthur, Texas, which captures CO2 from SMRs used in hydrogen production.146,147 While full-scale CCUS on a FCC has yet to be demonstrated, industrial-scale pilots have been successfully operated at Technology Centre Mongstad in Norway and a Sinopec refinery in China.148 These examples illustrate that, while CCUS deployment requires supportive infrastructure and investment, it is already operational at scale in industrial settings with concentrated CO2 emissions.149,150
Cement Manufacturing
The most mature post-combustion CCUS technology relevant to the cement industry today is the amine-based solvent method, in which CO2 from the flue gas leaving the cement kiln is scrubbed in an adsorption column, followed by a heated desorption step to remove the CO2 and regenerate the solvent.151,152 Notable amine-based CCUS cement facilities include Heidelberg Materials’ Brevik CCS cement plant in partnership with the Norwegian government, slated to begin production of their “evoZero” cement in 2025 and Anhui Conch’s CCUS cement plant in Baimashan, China, the country’s first fully integrated cement CCUS project that came online in 2018 with a capacity of 50,000 tonnes of cement per year.153,154 Oxyfuel cement kilns are also a promising approach to CCUS for this sector, with one demonstration plant operating in Qingzhou, China, and a number of full-scale facilities currently planned in the European Union.155 Also undergoing large- scale testing in Europe, direct separation reactors use an external heat source for the kiln, producing a relatively pure stream of CO2 from limestone calcination that requires little additional purification. Given the limited waste heat available at cement plants, CCUS processes which are largely electrically powered are of interest in some regions, including alternative post-combustion capture technologies such as pressure swing adsorption (PSA), temperature swing adsorption (TSA), and cryogenic processes. PSA and TSA technologies are commercially available and have been selected for full- scale projects in Poland and Germany.
Iron and Steel Manufacturing
In the iron and steel sector, CCUS is a key strategy for reducing emissions from blast furnace-basic oxygen furnace (BF- BOF) production, which still accounts for around 30 percent of U.S. steel output.156 The BF-BOF route emits large volumes of CO2 from both fossil fuel combustion and the chemical reduction of iron ore, making it a strong candidate for post- combustion and oxy-combustion capture technologies. These systems can be applied to off-gases such as blast furnace gas and basic oxygen furnace gas, which have relatively high CO2 concentrations. Pilot-scale work by companies such as ArcelorMittal in Belgium and Tata Steel in India have demonstrated capture from iron and steel processes, with capture technologies currently in the TRL 6–8 range depending on the configuration.157,158,159 CCUS can also be installed on the DRI process at the top gas stream which will abate between 55% and 60% of the CO2 emitted. Higher capture rates can also be achieved by installing capture at the reformer stack.137 While transitioning furnaces powered by clean electricity is a key long-term solution, CCUS may offer a transitional pathway to reduce emissions from legacy BF-BOF and new DRI plants in the near to medium term.
Alternative Production Processes
Petroleum Refining
In refineries, alternative production processes often focus on transitioning away from traditional crude oil refining altogether by shifting to biorefineries, electrofuel (e-fuel) production, or co-processing bio-based feedstocks. Technologies such as e-fuels combine CO2 captured from industrial sources with low-emission hydrogen to synthesize liquid fuels via methanol-to-gasoline processes or a well-established process known as “Fischer-Tropsch.”160 While e-fuels have high emissions reduction potential, they are currently at TRL 5–6 and face cost and efficiency barriers. Biorefineries, or facilities that convert biomass into fuels and chemicals, are slightly more mature with several commercial-scale operations underway or planned, with a TRL of 7–8 for many pathways. These alternative processes not only reduce life-cycle emissions but also offer the potential to repurpose existing refining infrastructure to produce cleaner end products.161,162
Chemical Manufacturing
In the chemicals sector, alternative production processes center on replacing fossil-based feedstocks and energy- intensive unit operations with low-emission or non-combustion alternatives. Particularly for ammonia, methanol, and hydrogen, emerging pathways focus on transitioning from unabated hydrogen to low-emission hydrogen. This low- emission hydrogen can be produced through electrolysis, utilizing water and low-carbon electricity, or by installing CCUS on steam methane reforming (SMR) or autothermal reforming (ATR). Production pathways for low-emission hydrogen are particularly critical given its use as both a combustion fuel for process heat as well as a feedstock for chemical production, both of which are discussed further in their respective sections below. Processes such as electrochemical ammonia synthesis or electrolytic hydrogen-to-methanol pathways offer near-zero emissions potential when powered by clean electricity, though most are still in early-stage demonstration (TRL 4–6) and require further development to match the efficiency and scalability of systems.163,164
Cement Manufacturing
Innovative cement production pathways such as electrochemical reactors and non-carbonate feedstocks (e.g., magnesium silicates, calcium silicates) aim to eliminate the need for high-temperature kilns and limestone, reducing both combustion and process emissions. These technologies are still in pilot stages (TRL 4–6), but the DOE has funded demonstration plants by Sublime Systems and Brimstone Energy, aiming to reach commercial-scale operation by 2026, which would raise the TRL for alternative cement production processes to level 8 or 9.165,166,167 Unfortunately, as of June 2025, both of these DOE awards have been cancelled.
Iron and Steel Manufacturing
One alternative to blast furnace-based ironmaking is Direct Reduced Iron (DRI). DRI is an ironmaking process that reduces iron ore to metallic iron (known as “sponge iron”) without melting it. This is accomplished by exposing iron ore to a reducing gas, traditionally syngas, which is a mixture of hydrogen and carbon monoxide created by reforming natural gas, but hydrogen is being increasingly considered. When green hydrogen, which is hydrogen produced through water electrolysis using renewable energy, is used as the reducing agent, the DRI process can markedly lower emissions compared to traditional blast furnace methods—as much as 95 percent reduction in emissions.168,169 The resulting sponge iron is typically melted in an EAF, enabling near-zero-emissions steelmaking when powered by clean electricity. If retrofitting a BF-BOF facility, installing the DRI and SAF processes in place of a blast furnace allows the integrated mill to retain the use of its BOF and finishing equipment while lowering emissions. SAFs are also capable of removing higher levels of slag than an EAF, allowing the mill to utilize lower quality, blast furnace-grade iron ore pellets.170 While natural gas-based DRI-EAF has lower emissions than unabated integrated mills, further decarbonization is limited without carbon capture or hydrogen. Broad deployment of hydrogen-based DRI will require substantial investment in infrastructure and abundant access to low-carbon energy sources. Natural gas-based DRI is well-established and widely deployed with a TRL of 9. Hydrogen-based DRI remains between 5-7, with ongoing pilot projects around the globe.171,172,173
Feedstock Substitutions
Petroleum Refining
In petroleum refining, feedstock substitution often takes the form of co-processing bio-based oils alongside crude oil, such as used cooking oil, tallow, and pyrolysis oils. This approach, considered TRL 8–9, may enable emissions reduction using existing hydrotreaters and refinery infrastructure with limited modifications. While already practiced at several U.S. and European refineries, widespread adoption is constrained by variability in feedstock quality, supply chain limitations, sustainable biomass supply, and blending compatibility.174,175
Chemical Manufacturing
In the chemical sector, fossil feedstocks such as naphtha and natural gas serve dual roles as fuel and material inputs, contributing substantially to both energy and process emissions. Six base chemicals (hydrogen, ammonia, methanol, ethylene, propylene, and benzene) account for roughly 65 percent of the sector’s emissions, largely due to the carbon intensity of their feedstocks.176 Substitution strategies include shifting to low-emission hydrogen, bio-based intermediates, or carbon-based circular feedstocks such as captured CO₂. For example, methanol can be synthesized from CO2 and low- emission hydrogen, while biomass-derived naphtha is under early-stage evaluation as a cracker input. These emerging approaches generally fall within TRL 4–6, with pilot projects underway but not yet scaled commercially.177,178
Cement Manufacturing
In the cement sector, feedstock substitution and clinker substitution offer complementary emissions reduction strategies. Feedstock substitutions involve replacing traditional limestone—which releases CO₂ during calcination—with alternative calcium- or magnesium-rich materials such as calcium silicates from basalt, steel slag, coal fly ash, or mining tailings. These alternatives aim to avoid or markedly reduce process emissions by bypassing or modifying the chemical reaction that releases CO₂, which overlaps with “Alternative Production Processes” as described above. By contrast, clinker substitution reduces emissions by lowering the proportion of emissions-intensive clinker in the final cement blend, replacing it with SCMs such as limestone, fly ash,179 or calcined clays. Though not a full substitute for traditional cement chemistry, this pathway can yield meaningful near-term reductions—up to 30 percent depending on the SCM mix. While U.S. clinker ratios remain relatively high (0.88), DOE-supported projects, such as Roanoke Cement’s LC3 pilot, aim to lower this ratio using viable TRL 9 substitutes and broaden market acceptance.180,181,182
Iron and Steel Manufacturing
Feedstock substitution in the iron and steel sector centers on increasing the use of recycled scrap steel and integrating low-emission iron sources such as H₂-DRI. Scrap-based production via EAFs is already widely deployed in the United States and is considered fully commercial at TRL 9, offering substantial emissions reductions compared to traditional blast furnace operations. However, scrap quality and availability, especially for high-spec flat steel products, limit how far this pathway can scale. As described above, H₂-DRI provides a viable low-emission complement for primary steelmaking and is currently being demonstrated at TRL 5–7. In the long term, a combination of improved scrap recovery, low-emission DRI, and optimized material flows, such as better scrap sorting, local reuse, and efficient supply chain integration, will be critical to achieving deep emissions reduction in the steel industry.183,184
Alternative Fuels
Petroleum Refining and Chemical Manufacturing
In both chemical manufacturing and petroleum refining, alternative fuels offer a transitional pathway to reduce combustion-related emissions from high-temperature processes. Many core operations, such as fired heaters, boilers, and steam reformers, rely heavily on fossil fuels such as natural gas. Substituting these fuels with lower-carbon alternatives such as certain biofuels (RNG) or low-emission hydrogen, can deliver emissions reductions without fully redesigning plant infrastructure, depending on the upstream emissions of the alternative fuel’s supply chain. Some biomass-derived and waste-derived fuels are relatively mature, with TRLs ranging from 8 to 9 depending on application and have seen deployment in auxiliary systems such as steam boilers and pre-heaters.185 However, their application in high-temperature process units is constrained by fuel consistency, energy density, and combustion behavior. Low-emission hydrogen, while offering substantial long-term emissions reduction potential, particularly for reformers and crackers, remains less mature for high-heat industrial applications, with most hydrogen combustion systems operating at TRL 5–7.186 These limitations stem from technical challenges in flame stability, burner retrofitting, and integration into continuous operations. As hydrogen infrastructure scales and the cost of low-emission hydrogen falls, adoption may increase, especially in processes that are otherwise difficult to electrify. In the meantime, alternative fuel adoption in these sectors will likely be incremental and targeted, serving as a useful complement to broader emissions reduction efforts.187
Cement Manufacturing
Alternative fuels are one of the most commercially ready emissions reduction options for the cement industry, with waste-derived fuels and biomass-derived fuels widely used today and considered high-TRL (TRL 9). While their lifecycle emissions reduction potential is relatively modest, they offer a cost-effective and immediately deployable solution, especially as full electrification remains technically challenging. Low-emission hydrogen holds long-term promise but is still at a lower TRL for cement applications and would require extensive infrastructure upgrades to achieve meaningful impact. Industry leaders such as Cemex and Holcim are already scaling the use of alternative fuels, signaling momentum for broader adoption.188,189
Iron and Steel Manufacturing
In the iron and steel sector, alternative fuels provide a near- to mid-term emissions reduction strategy for conventional BF-BOF operations. These systems rely heavily on coal and coke for both thermal energy and as chemical reducing agents. While complete substitution is limited by the metallurgical role of carbon, partial replacement with natural gas, biomass, waste-derived fuels, or RNG can lower emissions by reducing the amount of coke required. These fuels are commercially mature for use in blast furnaces and auxiliary systems, with TRLs of 8–9 depending on the application.190 Challenges remain in ensuring consistent fuel quality, maintaining furnace performance, and managing ash content, but co-firing approaches are already in use at several global pilot and commercial-scale facilities.191 As other emissions reduction technologies scale, alternative fuels can serve as a complementary measure to reduce emissions from legacy steelmaking infrastructure.
Energy and Materials Efficiency
Petroleum Refining and Chemical Manufacturing
Energy and materials efficiency are cost-effective and widely deployable strategies for reducing emissions in both chemical manufacturing and petroleum refining. In refineries, energy efficiency measures such as improved heat integration, furnace upgrades, process optimization, and waste heat recovery systems are commercially mature (TRL 9) and can reduce total energy use by 10–15 percent in many facilities.192 Similarly, in the chemical sector, common interventions include high-efficiency motors, variable speed drives, optimized steam systems, and process controls, with estimated energy savings potentials ranging from 10–20 percent depending on the process and facility configuration.193 Materials efficiency, such as solvent recovery, catalyst reuse, and reaction, yield improvements can further reduce input requirements and waste generation, thereby lowering both operational costs and emissions intensity. These strategies are especially valuable in older facilities, which often lag behind best-available technology benchmarks. While efficiency measures alone cannot fully decarbonize these sectors, they play a critical enabling role by reducing overall energy demand and improving the feasibility of electrification and carbon capture retrofits.
Cement Manufacturing
Energy and materials efficiency offers a low-cost, high-readiness pathway for near-term emissions reductions in the cement sector. On the production side, energy efficiency measures such as kiln optimization, improved grinding systems, and waste heat recovery are mature (TRL 8–9) but offer limited abatement potential, with diminishing returns as most plants already operate near optimal efficiency. On the demand side, design and construction efficiencies—such as lean design, material reuse, and building lifetime extension—can substantially reduce cement demand and associated emissions. These strategies are gaining traction and could cut emissions by over 20 percent by 2050, highlighting the important role of downstream actors in cement emissions reduction.194,195
Iron and Steel Manufacturing
Energy and materials efficiency are essential near-term levers for reducing emissions in iron and steel production. Commercially mature technologies (TRL 9) such as heat recovery systems, high-efficiency burners, variable speed drives, and oxygen optimization are already in use at many integrated steel plants and mini-mills. According to the International Energy Agency, these measures can reduce energy intensity by 10–20 percent, depending on the facility’s existing configuration and operational practices.196 Retrofitting older plants with these technologies alongside digital control systems can also yield rapid efficiency gains and contribute to sector-wide emissions reduction goals.197 Materials efficiency strategies also offer substantial emissions benefits by reducing demand for virgin steel. Approaches such as improved scrap sorting, closed-loop recycling, leaner product design, and extended product lifespans help lower embodied emissions across the value chain. For example, advanced sorting techniques can increase the availability of high-quality scrap suitable for flat steel production, thereby reducing reliance on primary steelmaking. While the emissions reductions from these strategies are typically incremental, they are low-cost, widely deployable, and synergistic with other low-emission technologies.
APPENDIX C
Policy Menu
1. Driving Innovation: Financial Support
1.1. State Tax Incentives
1.1.1. Property, Payroll, or Income Tax Credits
1.1.2. Investment Tax Credit
1.1.3. Accelerated Tax Depreciation Schedules
1.1.4. Tax Equity Partnerships
1.2. State Tax Credits to Augment Federal Support
1.3. Targeted State Support for Lower-TRL Technologies
1.4. State Support for Pilot and Demonstration Projects
1.5. Increased State Agency Support
1.5.1. Technical Assistance
1.5.2. Financial Matchmaking
1.5.3. Tax Credit Accessibility Assistance
1.5.4. State Decarbonization Roadmaps
2. Stimulating Demand: Low-Emission Markets
2.1. Environmental Product Declarations
2.2. State Contracts for Difference
2.3. State Preferential Bidding for Low-Emission Products
2.4. State Material Embodied Emissions Standards
2.5. Long-Term Procurement Commitments
2.5.1. Advanced Market Commitments
2.5.2. Clean Buyers’ Groups
2.5.3. Multi-State Procurement
3. Enabling Action: Streamlined Regulations and Improved Standards
3.1. State Siting and Permitting Reforms
3.1.1. Establish a comprehensive state review of siting and permitting challenges
3.1.2. Establish one-stop state permitting offices
3.1.3. Harmonized permitting
3.1.4. Establish energy corridors and industrial development districts with reduced and streamlined permitting requirements
3.1.5.Community benefits and engagement
3.1.6. Establish or expand existing port authorities for infrastructure
3.1.7. Substantial approval requirement relaxation
3.1.8. Agency review capacity enhancements
3.1.9. Industrial application preparedness initiatives
3.2. Performance-Based Standards for Low-Emission Industrial Products
3.3. Strengthened State Air Pollution Regulations
3.4. Extended Producer Responsibility for Industrial Products
4. Data, Monitoring, Compliance, and Stakeholder Engagement: Foundations for Effective State Low-Emission Industry Policy
4.1. Integrating Data, Compliance, and Engagement for Innovation
4.2. The Critical Role of Data and Monitoring
4.3. Ensuring Compliance and Accountability
4.4. Stakeholder Engagement for Policy Success
APPENDIX D
Citations for Policy Case Studies
Missouri
Missouri Department of Natural Resources Air Pollution Control Program, 2024. Missouri Plan for Environmental Improvement Grants. Available at: https://dnr.mo.gov/document-search/missouri-plan-environmental-improvement- grants [Accessed 16 April 2025].
Louisiana
State of Louisiana, Louisiana Department of Energy and Natural Resources. Office of Conservation. Permits and Applications. Updated June 2025. Available at: https://www.dnr.louisiana.gov/page/permits-and-applications#permit.
Shannon Heckt. 2025. “Battle over carbon storage in Louisiana launches in legislature.” Louisiana Illuminator. Available at: https://lailluminator.com/2025/04/16/carbon-storage-3/.
Gabriel Salinas and Philip Lau. 2024. An Update on Carbon Capture Legislation Following Louisiana’s 2024 Regular Session. Mayer Brown. Available at: https://www.mayerbrown.com/en/insights/publications/2024/06/an-update-on- carbon-capture-legislation-following-louisianas-2024-regular-legislative-session.
State of Louisiana, Louisiana Economic Development. On the Leading Edge of Carbon Capture and Storage Technology. Available at: https://www.opportunitylouisiana.gov/key-industry/energy/carbon-reduction/carbon-capture-storage.
Oil & Gas Watch. Carbon Capture and Storage in Louisiana. Available at: https://environmentalintegrity.org/wp-content/ uploads/2024/01/OGW_LACCSProjects_FactSheet_Final.pdf.
State of Louisiana, Department of Energy and Natural Resources. Office of Conservation, Pipeline Operations Program. Available at: https://www.dnr.louisiana.gov/page/pd-pipeline-operations-program pop#:~:text=The%20State%20has%20 close%20to,oil%20and%20gas%20production%20areas.
Air Products. Louisiana Clean Energy Complex. Available at: https://www.airproducts.com/energy-transition/louisiana- clean-energy-complex.
Colorado
Colorado Department of Public Health & Environment (CDPHE). 2024. 2023 Colorado Statewide Inventory of Greenhouse Gas Emissions and Sinks With Historical Emissions from 2005 through 2020 and Projected Emissions from 2021 through 2050, Updated Final Release. Available at: https://cdphe.colorado.gov/environment/air-pollution/climate-change/ GHGinventory.
Colorado Department of Public Health & Environment (CDPHE). 2020. Colorado 2015 Greenhouse Gas Inventory Update Including Projections to 2020 & 2030. Available at: https://cdphe.colorado.gov/environment/air-pollution/climate-change/ GHG-inventory.
Colorado General Assembly. 2019. House Bill 19-1261: Climate Action Plan to Reduce Pollution. Available at: https://leg.colorado.gov/bills/hb19-1261.
Colorado General Assembly. 2021. Environmental Justice Act (SB21-181). Available at: https://leg.colorado.gov/bills/sb21-181.
Colorado Energy Office. 2025. Colorado Carbon Management Roadmap. Available at: https://energyoffice.colorado.gov/ climate-energy/carbon-management-roadmap.
Industrial Innovation Initiative. 2024. Colorado Industrial Policies – State Toolkit. Available at: https://industrialinnovation. org/state-toolkit/colorado/.
Colorado Air Quality Control Commission. 2023. Greenhouse Gas Emissions and Energy Management for Manufacturing Phase 2 (GEMM 2) Rulemaking. Available at: https://cdphe.colorado.gov/aqcc-rulemaking/gemm2.
U.S. Census Bureau. 2023. “CB2100CBP All Sectors: County Business Patterns: 2021.” Available at: https://data.census. gov/table?q=CB2100CBP.
U.S. Census Bureau. 2020. “CB1800CBP All Sectors: County Business Patterns: 2018.” Available at: https://data.census. gov/table?q=CB2100CBP.
Coalition for Green Capital. 2024. Colorado Clean Energy Fund To Receive $30M To Accelerate Job Creation, Green Infrastructure Projects. Available at: https://coalitionforgreencapital.com/colorado-clean-energy-fund-to-receive-30m-to- accelerate-job-creation-green-infrastructure-projects/.
Colorado Sun. 2024. “Opinion: Implementing Project 2025 Would Harm Colorado’s Climate Economy.” Available at: https://coloradosun.com/2024/12/10/opinion-colorado-project-2025-climate-economy-damage/.
E2. 2024. Report: Colorado Home to 67K Clean Energy Jobs as Industry Outpaces Overall Economy. Available at: https://e2.org/releases/report-colorado-home-to-67k-clean-energy-jobs-as-industry-outpaces-overall-economy/.
Energy Innovation. 2024. How Project 2025 Could Affect Colorado. Available at: https://energyinnovation.org/wp- content/uploads/2024/09/How-Project-2025-Could-Affect-Colorado.pdf.
Pagosas Daily Post. 2023. “Colorado Clean Energy Employment Growing Faster Than Oil & Gas Jobs.” Available at: https://pagosadailypost.com/2023/10/16/colorado-clean-energy-employment-growing-faster-than-oil-gas-jobs/.
Cornell ILR. 2025. Colorado’s Clean Energy Jobs Path. Available at: https://www.ilr.cornell.edu/sites/default/ files-d8/2025-01/ilr_cji_colorado_state_report_january_2025.pdf.
Footnotes
- U.S. Census Bureau. County Business Patterns. Available at: https://www.census.gov/programs-surveys/cbp/data/tables.html.
- U.S. Energy Information Administration. (2023). Annual Energy Outlook 2023. Available at: https://www.eia.gov/outlooks/aeo/
- Center for Climate and Energy Solutions. “Climate 101: U.S. Emissions.” Available at: https://www.c2es.org/content/u-s-emissions/.
- U.S. Environmental Protection Agency. (2024). Inventory of U.S. Greenhouse Gas Emissions and Sinks: 1990–2022. Available at: https://www.epa.gov/ghgemissions/inventory-us-greenhouse-gas-emissions-and-sinks.
- This definition, for the purpose of this report, does not address other environmental factors such as water and land use. It also does not include decarbonization strategies for related sectors such as electricity and transportation, though these sectors both depend on and influence industrial processes.
- U.S. Bureau of Labor Statistics. (2025). “Employment, Hours, and Earnings from the Current Employment Statistics survey (National).” Available at: https://www.bls.gov/ces/
- U.S. Bureau of Labor Statistics. 2023. “Beyond the numbers: As manufacturing sector changes, production occupations disappear: an analysis of employment from 2007–20.” Available at: https://www.bls.gov/opub/btn/volume-12/as-manufacturing-sector-changes- production-occupations-disappear-1.htm.
- U.S. Census Bureau. County Business Patterns. (2022). Available at: https://www.census.gov/programs-surveys/cbp/data/tables.html.
- U.S. Department of Energy. (2023). “Pathways to Commercial Liftoff: Industrial Decarbonization.” Available at: https://liftoff.energy.gov/ industrial-decarbonization/overview/.
- U.S. Census Bureau. North American Industry Classification System (NAICS). Available at https://www.census.gov/naics/. Accessed March 27, 2025.
- NAICS code 32411.
- U.S. Census Bureau. County Business Patterns. Available at: https://www.census.gov/programs-surveys/cbp/data/tables.html.
- U.S. Bureau of Labor Statistics. National Employment Matrix: Petroleum and coal products manufacturing. Available at: https://data.bls.gov/ projections/nationalMatrix?queryParams=324000&ioType=i.
- U.S. Department of Energy. (2023). “Pathways to Commercial Liftoff: Decarbonizing Chemicals & Refining.” Available at: https://www. constructive.org/pathways-to-commercial-liftoff
- NAICS code 3251 includes petrochemical manufacturing, industrial gas manufacturing, synthetic dye and pigment manufacturing, other basic inorganic chemical manufacturing, other basic organic chemical manufacturing, ethyl alcohol manufacturing, cyclic crude,intermediate, and gum and wood manufacturing and all other basic organic chemical manufacturing. NAICS code 3253 includes fertilizer and agricultural chemical manufacturing.
- U.S. Census Bureau. County Business Patterns. Available at: https://www.census.gov/programs-surveys/cbp/data/tables.html.
- U.S. Department of Energy. (2023). “Pathways to Commercial Liftoff: Decarbonizing Chemicals & Refining.” Available at: https://www. constructive.org/pathways-to-commercial-liftoff.
- U.S. Bureau of Labor Statistics. National Employment Matrix: Chemical manufacturing. Available at: https://data.bls.gov/projections/ nationalMatrix?queryParams=3250A1&ioType=i.
- NAICS code 32731.
- U.S. Census Bureau. County Business Patterns. Available at: https://www.census.gov/programs-surveys/cbp/data/tables.html.
- U.S. Department of Energy. 2023. “Pathways to Commercial Liftoff: Low-Carbon Cement.” Available at: https://www.constructive.org/ pathways-to-commercial-liftoff.
- U.S. Bureau of Labor Statistics. National Employment Matrix: nonmetallic mineral manufacturing. Available at: https://data.bls.gov/ projections/nationalMatrix?queryParams=327000&ioType=i.
- NAICS code 3311, Iron and Steel Mills and Ferroalloy Manufacturing
- U.S. Census Bureau. County Business Patterns. Available at: https://www.census.gov/programs-surveys/cbp/data/tables.html.
- U.S. Department of Energy. (2023). “Pathways to Commercial Liftoff: Industrial Decarbonization.” Available at: https://www.constructive. org/pathways-to-commercial-liftoff.
- U.S. Bureau of Labor Statistics. National Employment Matrix: iron, steel, and ferroalloy manufacturing. Available at: https://data.bls.gov/ projections/nationalMatrix?queryParams=331100&ioType=i.
- Technology Readiness Levels (TRLs) are a framework developed by NASA for describing the maturity of an evolving technology to allow for consistent discussion across varying types of technology. See the following guide from the U.S. Department of Energy: https://www. directives.doe.gov/terms_definitions/technology-readiness-level.
- Schoeneberger, C., Zhang, J., McMillan, C., Dunn, J.B. and Masanet, E. (2022). “Electrification potential of US industrial boilers and assessment of the GHG emissions impact.” Advances in Applied Energy, 5, p.100089.
- Energy and Environmental Economics. (2024). “Decarbonizing Industrial Heat: Measuring Economic Potential and Policy Mechanisms.” Available at: https://www.ethree.com/wp-content/uploads/2024/10/CAELP-E3-Industrial-Electrification-Report.pdf.
- McKinsey & Company. (2024). “Tackling heat electrification to decarbonize industry.” Available at: https://www.mckinsey.com/industries/ industrials-and-electronics/our-insights/tackling-heat-electrification-to-decarbonize-industry.
- U.S. National Energy Technology Laboratory. “Carbon Dioxide Capture Approaches.” Available at: https://netl.doe.gov/research/carbon- management/energy-systems/gasification/gasifipedia/capture-approaches. Accessed April 14, 2025.
- ScienceDirect. “Pre-Combustion Capture.” Available at: https://www.sciencedirect.com/topics/engineering/pre-combustion-capture. Accessed April 14, 2025.
- International Energy Agency Greenhouse Gas R&D Programme. (2007). “Capturing CO2.” Available at: https://www.globalccsinstitute.com/ archive/hub/publications/95741/capturing-co2.pdf.
- Global CCS Institute. (2024). The Global Status of CCS: 2024. Melbourne: Global CCS Institute. Available at: https://www. globalccsinstitute.com/wp-content/uploads/2024/11/Global-Status-Report-6-November.pdf Accessed 13 May 2025.
- Note, 93 percent of operational CCUS project capacity in the United States is used for enhanced oil recovery. CO2-enhanced oil recovery can reduce emissions when using anthropogenic CO2, optimized injection strategies, and robust monitoring. However, its climate benefits are contingent on displacing higher-carbon oil, avoiding market-driven consumption increases, and integrating long-term sequestration. Thus, CO2-enhanced oil recovery may have a role as a transitional GHG mitigation tool but is not a long-term climate solution and requires complementary policies to limit fossil dependency.
- P.L. 117-58.
- P.L. 117-169
- U.S. Department of Energy. (2023). “Pathways to Commercial Liftoff: Carbon Management.” Available at: https://www.constructive.org/ pathways-to-commercial-liftoff.
- U.S. Department of Energy. (2023). “Pathways to Commercial Liftoff: Industrial Decarbonization.” Available at: https://www.constructive. org/pathways-to-commercial-liftoff.
- U.S. Department of Energy. (2023). “Pathways to Commercial Liftoff: Industrial Decarbonization.” Available at: https://www.constructive. org/pathways-to-commercial-liftoff.
- Fresh fly ash (collected directly from current coal combustion) and harvested fly ash (recovered from previously stored or landfilled sources) can both replace emissions-intensive clinker, reducing overall GHG emissions. However, using fresh fly ash offers greater GHG benefits, as harvesting and processing stored ash typically generates additional GHG emissions. Processing harvested fly ash also generates local air pollutant emissions. Using coal fly ash as a substitute in cement production is not without environmental risk, as improper handling can lead to contaminant leaching. However, EPA assessments and industry research consistently show that concrete containing fly ash does not leach more contaminants than conventional concrete, provided it is properly formulated. Typical disposal methods for fly ash, such as landfills and ash ponds, carry substantial risks of spills and long-term groundwater contamination; using fresh fly ash in cement not only helps reduce GHG emissions, but also offers a safer environmental solution to managing this hazardous byproduct of coal combustion.
- U.S. Department of Energy. (2023). “Pathways to Commercial Liftoff: Industrial Decarbonization.” Available at: https://www.constructive. org/pathways-to-commercial-liftoff.
- Note: waste-derived fuels and biomass have combustion emission rates similar to coal, but when considering the full lifecycle (such as the ability for plants to act as CO2 sinks through carbon-fixing photosynthesis), can have lower emission rates.
- U.S. Department of Energy. (2023). “Pathways to Commercial Liftoff: Industrial Decarbonization.” Available at: https://liftoff.energy.gov/industrial-decarbonization/overview/.
- McKinsey & Company. (2024). “Global Energy Perspective 2023: Sustainable fuels outlook.” Available at: https://www.mckinsey.com/industries/oil-and-gas/our-insights/global-energy-perspective-2023-sustainable-fuels-outlook.
- United States Climate Alliance. (2022). “Enabling Industrial Decarbonization: A Policy Guidebook for U.S. States.” Available at: https://usclimatealliance.org/guide/industrial-decarbonization-guide-dec-2022/.
- U.S. Department of Energy. (2023). “Pathways to Commercial Liftoff: Industrial Decarbonization.” Available at: https://liftoff.energy.gov/industrial-decarbonization/overview/.
- Energy Innovation and Forbes. (2019). “How To Reach U.S. Net Zero Emissions By 2050: Decarbonizing Industry.” Available at: https://www.forbes.com/sites/energyinnovation/2019/11/04/how-to-reach-us-net-zero-emissions-by-2050-decarbonizing-industry/.
- J. Kim, et al. (2024). “Energy, material, and resource efficiency for industrial decarbonization: A systematic review of sociotechnical systems, technological innovations, and policy options.” Energy Research & Social Science 112, 103521. Available at: https://doi.org/10.1016/j.erss.2024.103521.
- Manufacturing Dive. (2025). “Tracking the Inflation Reduction Act’s Impact on US manufacturing.” Available at: https://www.manufacturingdive.com/news/inflation-reduction-act-tracker-clean-energy-manufacturing/715116/.
- Considers only private capital already spent and projects constructed on IRA-eligible clean technology manufacturing, utility-scale clean electricity, and industrial decarbonization facilities that have opened between August 2022 and March 2025. Rhodium Group. (2025). Clean Investment Monitor: Q1 2025 Update. Available at: https://rhg.com/research/clean-investment-monitor-q1-2025-update/.
- Clean Air Task Force. (2025). “U.S. federal clean energy investment.” https://www.catf.us/us/us-federal-clean-energy-investments/.
- Clean Air Task Force. (2025). “Restructuring Innovation for the Zero-Carbon Climate: Blueprint for Innovation Technology Framework.” https://www.catf.us/resource/restructuring-innovation-for-the-zero-carbon-climate-blueprint-for-an-innovation-technology-framework/.
- P.L. 117-58, § 41201.
- Clean Air Task Force. (2023). “Two years of IIJA: An overview of carbon management implementation to date.” https://www.catf.us/2023/12/ two-years-iija-overview-carbon-management-implementation-date/.
- Green hydrogen is produced from electrolysis using renewable energy sources. Blue hydrogen is produced primarily from natural gas with resulting emissions captured through carbon capture and storage. Biomass-based hydrogen is made through gasification of organic materials at high heat without combustion. For additional information, see CATF Hydrogen Hubs: https://www.catf.us/hydrogen/hydrogen-hubs/
- For additional information, see Clean Air Task Force. (2024). Federal Funding Programs for Clean Industrial Innovation: A Guide for States. Available at: https://www.catf.us/resource/federal-funding-programs-clean-industrial-innovation-guide-states/.
- See U.S. Bureau of Labor Statistics. CPI Inflation Calculator.
- U.S. Department of Energy. (2025). “Qualifying Advanced Energy Project Credit (48C) Program.” Available at: https://www.energy.gov/ infrastructure/qualifying-advanced-energy-project-credit-48c-program.
- Hoptown Chronicle (2025) “Ascend Elements cancels a portion of planned production line at Hopkinsville plant.” Available at: https://hoptownchronicle.org/ascend-elements-to-cancel-a-portion-of-planned-production-line-at-hopkinsville-plant/
- Air Products (2025) “Air Products to Exit Three U.S.-Based Projects | News Release.” Available at: https://www.airproducts.com/company/ news-center/2025/02/0224-air-products-to-exit-three-us-based-projects
- Aspen Aerogels (2025) “Aspen Aerogels cancels its LPO loan and its Georgia factory.” Available at: https://www.latitudemedia.com/news/ why-aspen-aerogels-cancelled-its-lpo-loan-and-its-georgia-factory/
- Francis, N. (2016). State Tax Incentives for Economic Development. Urban Institute. Available at: https://www.urban.org/sites/default/files/ publication/78206/2000636-state-tax-incentives-for-economic-development.pdf.
- Louisiana Economic Development. (2022). “ITEP Overview and History.” Available at: https://house.louisiana.gov/wm/Docs/2022/NOV/ LA%20Economic%20Development%20-%20ITEP.pdf
- Georgia Department of Economic Development. (2025). “Investment Tax Credit.” Available at: https://georgia.org/investment.
- Congressional Research Service. (2019). Tax Equity Financing: An Introduction and Policy Considerations. R45693. Available at: https://www.congress.gov/crs-product/R45693.
- Ibid.
- O’Meara, M. (2022). “Everything You Need to Know about State LIHTCs in 2022.” Available at: https://www.novoco.com/periodicals/ articles/everything-you-need-know-about-state-lihtcs-2022
- New Mexico Partnership. (2024). “Gov. Michelle Lujan Grisham Signs New Advanced Energy Tax Credit Into Law.” Available at: https://nmpartnership.com/gov-michelle-lujan-grisham-signs-new-advanced-energy-tax-credit-into-law/.
- EFI Foundation. (2025). Unlocking Private Capital for Carbon Capture and Storage Projections in Industry and Power. Available at: https://efifoundation.org/wp-content/uploads/sites/3/2025/04/Unlocking-Private-Capital-for-CCS-Projects-in-Industry-and-Power.pdf.
- New Mexico Legislature. (2025). “Industrial decarbonization production credits.” https://www.nmlegis.gov/Legislation/ Legislation?chamber=H&legType=B&legNo=538&year=25.
- Pece, C. (2024). State Government Agencies’ Expenditures for R&D Total $3.0 Billion in FY 2023, an Increase of 14% from FY 2022. National Center for Science and Engineering Statistics, National Science Foundation. Available at: https://ncses.nsf.gov/pubs/nsf25308.
- Ibid.
- Ibid.
- Ibid.
- Ibid.
- U.S. Department of Energy (2023). DOE selects Arizona State University to lead new institute to drive industrial decarbonization. Available at: https://www.energy.gov/eere/iedo/doe-selects-arizona-state-university-lead-new-institute-drive-industrial-decarbonization (Accessed: May 16, 2025).
- https://netl.doe.gov/sites/default/files/netl-file/23CLD_Leong.pdf
- North Dakota, Office of the Governor. (2021). “Burgum signs bill creating Clean Sustainable Energy Fund to support low-emission technology projects.” Available at: https://www.nd.gov/news/burgum-signs-bill-creating-clean-sustainable-energy-fund-support-low- emission-technology.
- Malhotra, A and Schmidt, T. (2020). “Accelerating Low-Carbon Innovation.” Joule 4, 2259–2267. Available at: https://doi.org/10.1016/j. joule.2020.09.004.
- State of Illinois. (2023). State of Illinois: Climate Pollution Reduction Grant Implementation Grant. Available at: https://epa.illinois.gov/ content/dam/soi/en/web/epa/topics/climate/documents/soi-cprg-implementation-grant.pdf.
- Ibid.
- U.S. Environmental Protection Agency. (2025). “Green Banks.” Available at: https://www.epa.gov/statelocalenergy/green-banks.
- Evergreen Collaborative. 2025. Powering Progress: Industrial Decarbonization Planning at the State Level. Available at: https://collaborative. evergreenaction.com/memos/powering-progress-industrial-decarbonization-planning-at-the-state-level-8?utm_source=policy&utm_ medium=referral&utm_campaign=industry.
- U.S. Environmental Protection Agency. (2025). “Green Banks.” Available at: https://www.epa.gov/statelocalenergy/green-banks.
- Product-specific EPDs are developed for a specific product by a manufacturer based on their lifecycle assessment, whereas industry- specific EPDs represent the average impact of a product category across multiple manufacturers in an industry.
- Some states may have authority to support EPDs within existing budgets or require EPDs under administrative or rulemaking processes.
- New York State, Office of General Services, NYS Buy Clean Concrete Guidelines. https://ogs.ny.gov/nys-buy-clean-concrete-guidelines- 0#:~:text=The%20NYS%20Buy%20Clean%20Concrete,deemed%20appropriate%20by%20the%20office.
- American Institute for Steel Construction. Environmental Product Declarations.
- ASTM International. Environmental Product Declarations. https://www.astm.org/standards-and-solutions/certification/environmental- product-declarations/epd-pcr.
- Tasaki, Tomohiro & Shobatake, Koichi & Nakajima, Kenichi & Dalhammar, Carl. (2017). International Survey of the Costs of Assessment for Environmental Product Declarations. Procedia CIRP.
- Cameron J. Hepburn. (2005). Carbon contracts and energy policy: An outline proposal.
- CATF. (2024). Designing Carbon Contracts for Difference. Available at: https://www.catf.us/resource/designing-carbon-contracts-for- difference/
- CATF. (2022). Why Carbon Contracts for Difference could be the policy measure Europe needs to decarbonise industry.
- Toby Lockwood. (2024). Designing Carbon Contracts for Difference. CATF.
- Agnieszka Ason & Julio Dal Poz. (2024). Contracts for Difference: the Instrument of Choice for the Energy Transition. The Oxford Institute for Energy Studies.
- German Federal Ministry of Economic Affairs and Climate Action. (2024). Press Release: First round of carbon contract for difference launched. https://www.bmwk.de/Redaktion/EN/Pressemitteilungen/2024/03/20240312-first-round-of-carbon-contracts-for-difference-launched.html.
- New York State and New Jersey proposed Low-Embodied Carbon Concrete Leadership Act. See also “New Jersey Adopts First-of-a-Kind Low carbon Concrete Law.” NRDC (Jan. 31, 2023).
- National Association of State Procurement Officials. https://www.naspo.org/research-and-innovation/state-preference-repository/.
- New York State and New Jersey proposed Low-Embodied Carbon Concrete Leadership Act. See also “New Jersey Adopts First-of-a-Kind Low carbon Concrete Law.” NRDC (Jan. 31, 2023).
- These provisions were dropped in the final version of the law, due to opposition from industry groups, who argued that the incentives would add excessive paperwork and costs without substantially impacting carbon reductions.
- California Department of General Services. No date. “Buy Clean California Act.” https://www.dgs.ca.gov/pd/resources/page-content/ procurement-division-resources-list-folder/buy-clean-california-act?utm.
- Colorado Office of the State Architect. No date. “Buy Clean Colorado Act.” https://osa.colorado.gov/energy-environment/buy-clean- colorado-act.
- New York State. No date. “Buy Clean Concrete Guidelines.” https://ogs.ny.gov/nys-buy-clean-concrete-guidelines-0.
- U.S. Department of Energy. (2023). “Pathways to Commercial Liftoff: Low-Carbon Cement.” Available at: https://www.constructive.org/ pathways-to-commercial-liftoff.
- Eash-Gates, P., S. Koester, L. Metz, J. Hittinger, A. Hopkins, I. Weiss. (2025). Recasting the Future: Policy Approaches to Drive Cement Decarbonization. Prepared by Synapse Energy Economics for the Clean Air Task Force. Available at https://www.catf.us/resource/recasting- future-policy-approaches-drive-cement-decarbonization/.
- U.S. Department of Transportation. (2024). “Investing in America: USDOT Awards $1.2 Billion in Grants to Help State Departments of Transportation Utilize Cleaner Construction Materials.” Available at: https://www.transportation.gov/briefing-room/investing-america- usdot-awards-12-billion-grants-help-state-departments.
- U.S. Department of Transportation. (2024). FY 2025 Budget Highlights, U.S. Department of Transportation. Available at: https://www. transportation.gov/sites/dot.gov/files/2024-03/DOT_Budget_Highlights_FY_2025_508.pdf.
- Jon Hurdle. (2024). Multi-state offshore wind pact weakened after Connecticut sits out first selection. Inside Climate News. https://insideclimatenews.org/news/13112024/new-england-offshore-wind-pact-weakened-after-connecticut-sits-out/.
- See Executive Order 620: Establishing the Commission on Energy Infrastructure Siting and Permitting. From https://www.mass.gov/ executiveorders/no-620-establishing-the-commission-on-energy-infrastructure-siting-and-permitting, accessed February 23, 2024.
- Federal Energy Regulatory Commission. (2023). Order No. 2023: Improvements to Generator Interconnection Procedures and Agreements, 28 July, 184 FERC ¶ 61,054.
- See U.S. Bureau of Land Management’s West-wide Energy Corridors. https://www.blm.gov/energy-corridors.
- Department of Energy. (2025). https://www.energy.gov/gdo/national-interest-electric-transmission-corridor-designation-process.
- Clean Air Task Force. (2023). “Community Benefits Programs and Clean Energy.” https://www.catf.us/resource/community-benefits- programs-clean-energy/.
- Clean Air Task Force. No date. “Community Benefits Resource Inventory.” https://www.catf.us/infrastructure-deployment/community- benefits-resource-inventory/.
- See ASTM C1157: Standard Performance Specification for Hydraulic Cement. Available at: https://store.astm.org/c1157-08a.html.
- See, University of Oregon Law School, “State Authority to Implement the Clean Air Act’s International Pollution Provision,” Appendix (June 2021), available at: https://law.uoregon.edu/sites/default/files/state_authority_to_implement_the_clean_air_act-.pdf (updating the results in NACAA, “Restrictions on the Stringency of State and Local Air Quality Programs, Results of a Survey by the National Association of Clean Air Agencies (NACAA),”.
- U.S. Environmental Protection Agency. (2023). “State Implementation Plan (SIP) Process.” Available at: https://www.epa.gov/sips.
- United States Code. (2023). Clean Air Act, 42 U.S.C. § 7407(a), § 7410(a).
- Shapiro, J.S. & Walker, R. (2018). “Why is pollution from US manufacturing declining? The roles of environmental regulation, productivity, and trade.” American Economic Review, 108(12), 3814–3854.
- National Association of Clean Air Agencies. (2014), “Restrictions on the Stringency of State and Local Air Quality Programs.” https://www.4cleanair.org/wp-content/uploads/Documents/Stringency_Report_12_04_2014.pdf.
- See Evergreen Collaborative, Accelerating the Clean Air Act’s Innovation Engine (2024), https://collaborative.evergreenaction.com/policy- hub/Accelerating-the-Clean-Air-Acts-Innovation-Engine-March-2024.pdf; Alan Masinter & Katie Blair, Clean Air Task Force, Two key ways EPA can fast track air permitting reforms to advance cleaner, low-carbon technologies (2024), https://www.catf.us/2024/07/two-key-ways- epa-can-fast-track-air-permitting-reforms-advance-cleaner-low-carbon-technologies/.
- Colorado Air Pollution Control Division. (2023). Regulation 22 – 5 CCR 1001-26: Greenhouse Gas Emissions and Energy Management for Manufacturing. Colorado Department of Public Health & Environment. Available at: https://cdphe.colorado.gov/apcd.
- Louisiana Department of Environmental Quality. (2022). Title 33, Part III, Chapter 22: Air Toxics Monitoring and Reporting Requirements. Available at: https://www.deq.louisiana.gov/page/air-toxics.
- Texas Commission on Environmental Quality. (2024). State Implementation Plan (SIP) Revision for the Houston-Galveston-Brazoria Ozone Nonattainment Area. Austin, TX: TCEQ. Available at: https://www.tceq.texas.gov/airquality/sip/hgb/sip-revisions.
- New Jersey Department of Environmental Protection. (2020). Environmental Justice Law, P.L.2020, c.92 (NJ S232). Trenton, NJ: NJDEP. Available at: https://www.nj.gov/dep/ej/policy.html.
- California Air Resources Board. (2024). “Cap-and-Trade Program.” Available at: https://ww2.arb.ca.gov/our-work/programs/cap-and-trade- program.
- See National Council on State Legislatures. (2023). Extended Producer Responsibility. https://www.ncsl.org/environment- and-natural-resources/extended-producer-responsibility.
- Katie Pyzyk. (2024). “Compostable packaging must be included in EPR needs assessments, industry partners say.” Packaging Dive. https://www.packagingdive.com/news/compostable-packaging-extended-producer-responsibility-epr-needs-assessment/705929/.
- U.S. Department of Energy. (2023). “Pathways to Commercial Liftoff: Decarbonizing Chemicals & Refining.” Available at: https://www.constructive.org/pathways-to-commercial-liftoff.
- U.S. Department of Energy. Office of Energy Efficiency and Renewable Energy. (2022). “Thermal Process Intensification: Transforming the Way Industry Uses Thermal Process Energy.” Available at: https://www.energy.gov/sites/default/files/2022-05/TPI%20Workshop%20 Report_AMO.pdf.
- World Resources Institute. (2021). “A Low-Carbon Future in the US Depends on Decarbonizing Petroleum Refineries.” Available at: https://www.wri.org/insights/technologies-decarbonize-petroleum-refineries.
- BASF. (2024). “BASF, SABIC, and Linde celebrate the start-up of the world’s first large-scale electrically heated steam cracking furnace.” Available at: https://www.basf.com/global/en/media/news-releases/2024/04/p-24-177.
- Technip Energies. (2023). “Technip Energies, LyondellBasell and Chevron Phillips Chemical Sign MOU for Electric Cracking Ethylene Furnace.” Available at: https://www.ten.com/en/media/news/technip-energies-lyondellbasell-and-chevron-phillips-chemical-sign-mou-electric-cracking.
- Canary Media. (2023). “This key chemical is super dirty to make. Can an electric furnace help?” Available at: https://www.canarymedia.com/ articles/clean-industry/this-key-chemical-is-super-dirty-to-make-can-an-electric-furnace-help.
- RMI. (2025). “Chemistry in Transition: Charting solutions for a low-emissions chemical industry.” Available at: https://rmi.org/chemistry-in- transition-charting-solutions-for-a-low-emissions-chemical-industry/.
- U.S. Department of Energy. (2023). “Pathways to Commercial Liftoff: Low-Carbon Cement.” Available at: https://www.constructive.org/ pathways-to-commercial-liftoff.
- Eash-Gates, P., S. Koester, L. Metz, J. Hittinger, A. Hopkins, I. Weiss. (2025). Recasting the Future: Policy Approaches to Drive Cement Decarbonization. Prepared by Synapse Energy Economics for the Clean Air Task Force. Available at https://www.catf.us/resource/recasting- future-policy-approaches-drive-cement-decarbonization/.
- Katajisto, O. “Cement precalcination with electricity and carbon dioxide sequestration.” Presentation at VTT, May 25, 2022. Available at: https://www.decarbonate.fi/wp-content/uploads/2022/05/2022-05-17-Betonitutkimusseminaari.pdf.
- Cemex. (2022). “CEMEX and Coolbrook electrify cement production process.“ Available at: https://www.cemex.com/w/cemex-and-coolbrook- electrify-cement-production-process.
- CRU and CATF (2025). “Decarbonization Pathways and Policy Recommendations for the United States Steel Sector.” Available at: https://www.catf.us/resource/decarbonization-pathways-policy-recommendations-united-states-steel-sector/.
- U.S. Department of Energy. (2023). “Pathways to Commercial Liftoff: Low-Carbon Cement.” Available at: https://www.constructive.org/ pathways-to-commercial-liftoff.
- United States Climate Alliance. (2022). “Enabling Industrial Decarbonization: A Policy Guidebook for U.S. States.” Available at: https://usclimatealliance.org/guide/industrial-decarbonization-guide-dec-2022/.
- Haffner. (2024). “Solvent-Based Post Combustion Carbon Capture.” Power Engineers. Available at: https://www.powereng.com/library/ solvent-based-post-combustion-carbon-capture. Accessed 1/2/2025.
- Worley Consulting and Clean Air Task Force. (2024). “Refinery of the Future: Decarbonisation Options.” Available at: https://cdn.catf.us/wp- content/uploads/2024/07/29181610/refinery-of-the-future.pdf.
- L. Rock, et al. (2017). “The Quest CCS Project: 1st Year Review Post Start of Injection.” Energy Procedia 114, 5320-5328. Available at: https://doi.org/10.1016/j.egypro.2017.03.1654.
- Air Products. “Large-scale Carbon Capture System First of Its Kind.” Available at: https://www.airproducts.com/company/innovation/ carbon-capture. Accessed April 14, 2025
- Zhang et al. (2017). “Sinopec Zhongyuan Oil Field Company Refinery CCS-EOR Project.” Energy Procedia, 114; 5869 Available at: https://www.sciencedirect.com/science/article/pii/S1876610217319252.
- RMI. (2025). “Chemistry in Transition: Charting solutions for a low-emissions chemical industry.” Available at: https://rmi.org/chemistry-in- transition-charting-solutions-for-a-low-emissions-chemical-industry/.
- University of Pennsylvania. Kleinman Center for Energy Policy. (2024). “U.S. CCS Ladder for Industrial Decarbonization.” Available at: https://kleinmanenergy.upenn.edu/commentary/blog/u-s-ccs-ladder-for-industrial-decarbonization/.
- Global Cement and Concrete Association. Post-Combustion Capture. Available at: https://gccassociation.org/cement-and-concrete- innovation/carbon-capture-and-utilisation/post-combustion-capture/
- K. Jiang, et al. (2024). “Zero-Emission Cement Plants with Advanced Amine-Based CO2 Capture” Environ. Sci. Technol. 58, 6978–6987. Available at: https://doi.org/10.1021/acs.est.4c00197.
- Heidelberg Materials. “Brevik CCS – World’s first CO₂-capture facility in the cement industry” Available at: https://www.brevikccs.com/en. Accessed 1/2/2025.
- Global Cement and Concrete Association. (2024). “China begins operations at the world’s largest oxy-fuel combustion CCUS project in cement sector.” Available at: https://www.globalccsinstitute.com/news-media/insights/china-begins-operations-at-the-worlds-largest-oxy-fuel- combustion-ccus-project-in-cement-sector/.
- Clean Air Task Force (2025) “The role for carbon capture and storage in decarbonising Europe’s cement sector.” Available at: https://www.catf. us/resource/role-carbon-capture-storage-decarbonising-europes-cement-sector/.
- U.S. Department of Energy. (2023). “Pathways to Commercial Liftoff: Industrial Decarbonization.” Available at: https://www.constructive. org/pathways-to-commercial-liftoff.
- Reuters. (2024). “ArcelorMittal, MHI launch pilot CO2 capture unit at Gent blast furnace.” Available at: https://www.reuters.com/ sustainability/arcelormittal-mhi-launch-pilot-co2-capture-unit-gent-blast-furnace-2024-05-21/.
- Tata Steel. (2022). “Forging Sustainable Steel.” Available at: https://www.tata.com/newsroom/business/tata-steel-sustainable-aalingana.
- Net Zero Industry. “Methodology.” Available at: https://netzeroindustry.org/methodology/. Accessed April 14, 2025.
- V. Eyberg, et al. (2024). “Techno-economic assessment and comparison of Fischer–Tropsch and Methanol-to-Jet processes to produce sustainable aviation fuel via Power-to-Liquid.” Energy Conversion and Management 315, 118728. Available at: https://doi.org/10.1016/j. enconman.2024.118728.
- United States Climate Alliance. (2022). “Enabling Industrial Decarbonization: A Policy Guidebook for U.S. States.” Available at: https://usclimatealliance.org/guide/industrial-decarbonization-guide-dec-2022/.
- Worley Consulting and Clean Air Task Force. (2024). “Refinery of the Future: Decarbonisation Options.” Available at: https://cdn.catf.us/wp- content/uploads/2024/07/29181610/refinery-of-the-future.pdf.
- U.S. Department of Energy. (2024). “Pathways to Commercial Liftoff: Clean Hydrogen.” Available at: https://www.constructive.org/ pathways-to-commercial-liftoff.
- Hensley Energy Consulting and Center for Applied Environmental Law and Policy. 2023. “Report on CO2 Abatement Opportunities at Existing Industrial Hydrogen and Ammonia Production Plants.” Available at: https://www.caelp.org/s/CAELP-Hydrogen-and-Ammonia- Report-10-4-2023-FINAL.pdf.
- U.S. Department of Energy. (2024). “Pathways to Commercial Liftoff: Clean Hydrogen.” Available at: https://www.constructive.org/ pathways-to-commercial-liftoff.
- Sublime Systems. (2024). “Sublime Systems Selected by U.S. Department of Energy to Receive $87M Investment to Accelerate Commercial- Scale, True-Zero Cement Manufacturing Technology” Available at: https://sublime-systems.com/sublime-systems-selected-by-u-s- department-of-energy-to-receive-87m-investment-to-accelerate-commercial-scale-true-zero-cement-manufacturing-technology/.
- Brimstone. (2024). “Industrial Demonstrations Program Selects Brimstone for Transformational $189 Million Federal Investment to Decarbonize Cement Industry” Available at: https://www.brimstone.com/post/industrial-demonstrations-program-selects-brimstone-for-transformational- 189-million-federal-invest.
- RMI. (2023). “Opportunities for Near-Zero-Emissions Steel Production in the Great Lakes.” Available at: https://rmi.org/gap-analysis-for- near-zero-emissions-steel-production-in-the-great-lakes/.
- Hitachi Energy. (2024). “Decarbonizing Iron & Steelmaking with Green Hydrogen.” Available at: https://www.hitachienergy.com/us/en/news- and-events/blogs/2024/05/decarbonizing-iron-and-steelmaking-with-green-hydrogen.
- CRU and CATF (2025). “Decarbonization Pathways and Policy Recommendations for the United States Steel Sector.” Available at: https://www.catf.us/resource/decarbonization-pathways-policy-recommendations-united-states-steel-sector/
- Shahabuddin, et al. (2023). “Decarbonisation and hydrogen integration of steel industries: Recent development, challenges and technoeconomic analysis.” Journal of Cleaner Production 395, 136391. Available at: https://doi.org/10.1016/j.jclepro.2023.136391.
- R. Scaccabarozzi, et al. 2025. “Technical analysis of high-efficiency and flexible direct reduced iron plants integrated with high-temperature electrolysis.” Journal of Cleaner Production 489, 144681. Available at: https://doi.org/10.1016/j.jclepro.2025.144681.
- Hybrit Fossil-Free Steel. “Pilot scale direct reduction with hydrogen.” Available at: https://www.hybritdevelopment.se/en/a-fossil-free- development/direct-reduction-hydrogen-pilotscale/.
- Worley Consulting and Clean Air Task Force. (2024). “Refinery of the Future: Decarbonisation Options.” Available at: https://cdn.catf.us/wp- content/uploads/2024/07/29181610/refinery-of-the-future.pdf.
- United States Climate Alliance. (2022). “Enabling Industrial Decarbonization: A Policy Guidebook for U.S. States.” Available at: https://usclimatealliance.org/guide/industrial-decarbonization-guide-dec-2022/.
- RMI. (2025). “Chemistry in Transition: Charting solutions for a low-emissions chemical industry.” Available at: https://rmi.org/chemistry-in- transition-charting-solutions-for-a-low-emissions-chemical-industry/.
- U.S. Department of Energy. (2024). “Pathways to Commercial Liftoff: Clean Hydrogen.” Available at: https://www.constructive.org/ pathways-to-commercial-liftoff
- Hensley Energy Consulting and Center for Applied Environmental Law and Policy. (2023). “Report on CO2 Abatement Opportunities at Existing Industrial Hydrogen and Ammonia Production Plants.” Available at: https://www.caelp.org/s/CAELP-Hydrogen-and-Ammonia- Report-10-4-2023-FINAL.pdf.
- See supra n.40
- World Resources Institute. (2024). “The US Needs to Lower Cement Emissions — ‘Blended Cement’ Can Help.” Available at: https://www.wri.org/insights/lower-carbon-blended-cement.
- U.S. Department of Energy. (2023). “Pathways to Commercial Liftoff: Low-Carbon Cement.” Available at: https://www.constructive.org/ pathways-to-commercial-liftoff.
- Eash-Gates, P., S. Koester, L. Metz, J. Hittinger, A. Hopkins, I. Weiss. (2025). Recasting the Future: Policy Approaches to Drive Cement Decarbonization. Prepared by Synapse Energy Economics for the Clean Air Task Force. Available at https://www.catf.us/resource/recasting- future-policy-approaches-drive-cement-decarbonization/.
- RMI. (2023). “Opportunities for Near-Zero-Emissions Steel Production in the Great Lakes.” Available at: https://rmi.org/gap-analysis-for- near-zero-emissions-steel-production-in-the-great-lakes/.
- U.S. Department of Energy. (2024). “Pathways to Commercial Liftoff: Clean Hydrogen.” Available at: https://www.constructive.org/ pathways-to-commercial-liftoff.
- IEA Bioenergy Technology Collaboration Programme. (2024). “Update on drop-in biofuel and coprocessing commercialization.” Available at: https://www.ieabioenergy.com/wp-content/uploads/2024/09/IEA-Bioenergy-Task-39-drop-in-biofuels-and-co-processing- report-June-2024.pdf.
- Worley Consulting and Clean Air Task Force. (2024). “Refinery of the Future: Decarbonisation Options.” Available at: https://cdn.catf.us/wp- content/uploads/2024/07/29181610/refinery-of-the-future.pdf.
- Hensley Energy Consulting and Center for Applied Environmental Law and Policy. (2023). “Report on CO2 Abatement Opportunities at Existing Industrial Hydrogen and Ammonia Production Plants.” Available at: https://www.caelp.org/s/CAELP-Hydrogen-and-Ammonia- Report-10-4-2023-FINAL.pdf.
- Eash-Gates, P., S. Koester, L. Metz, J. Hittinger, A. Hopkins, I. Weiss. (2025). Recasting the Future: Policy Approaches to Drive Cement Decarbonization. Prepared by Synapse Energy Economics for the Clean Air Task Force. Available at https://www.catf.us/resource/recasting- future-policy-approaches-drive-cement-decarbonization/.
- S. Griffiths, et al. (2023). “Decarbonizing the cement and concrete industry: A systematic review of socio-technical systems, technological innovations, and policy options” Renewable and Sustainable Energy Reviews 180 (2023) 113291. Available at: https://doi.org/10.1016/j. rser.2023.113291.
- International Energy Agency. (2020). “Iron and Steel Technology Roadmap.” Available at: https://www.iea.org/reports/iron-and-steel- technology-roadmap.
- IEA Bioenergy Technology Collaboration Programme. (2016). “The status of large scale biomass firing.” Available at: https://www. ieabioenergy.com/blog/publications/the-status-of-large-scale-biomass-firing/.
- U.S. Department of Energy. 2023. “Pathways to Commercial Liftoff: Industrial Decarbonization.” Available at: https://www.constructive.org/ pathways-to-commercial-liftoff.
- RMI. (2025). “Chemistry in Transition: Charting solutions for a low-emissions chemical industry.” Available at: https://rmi.org/chemistry-in- transition-charting-solutions-for-a-low-emissions-chemical-industry
- Benhelal, et al. (2021). “Challenges against CO2 abatement strategies in cement industry: A review” Journal of Environmental Sciences
- 104 (2021), 84-101, ISSN 1001-0742. Available at: https://doi.org/10.1016/j.jes.2020.11.020.
- U.S. Department of Energy. 2023. “Pathways to Commercial Liftoff: Industrial Decarbonization.” Available at: https://www.constructive.org/ pathways-to-commercial-liftoff.
- International Energy Agency. (2020). “Iron and Steel Technology Roadmap.” Available at: https://www.iea.org/reports/iron-and-steel- technology-roadmap.
- Oak Ridge National Laboratory. (2022). “Potential Decarbonization Strategies and Challenges for the U.S. Iron & Steel Industry.” Available at: https://www.energy.gov/sites/default/files/2022-02/Nimbalkar%20-%20ORNL%20-%20Decarbonizing%20US%20Steel%20Industry.pdf.
Credits
Authors
- Sam Bailey, Clean Air Task Force
- Jeremy Tarr, Clean Air Task Force
- Lindsay Cooper Phillips, Clean Air Task Force
Acknowledgements
We acknowledge the analytical contributions of Synapse Energy Economics, and thank Philip Eash-Gates, PE,
Joe Hittinger, PhD, Stephan Koester, and Lucy Metz, and the broader Synapse team for their support in developing the analysis that informed this report.

