

The geography of clean energy investments in the U.S.


The American energy system is experiencing a profound transformation as a result of a confluence of factors, from rising electricity demand in emerging sectors and domestic reshoring to a rise in private investments across a wide range of clean energy technologies and applications.
At the core of this transformation are federal incentives that signaled a new era of American industrial and energy policy, which the private sector has responded to with a surge of investments across the U.S. These incentives, in the form of tax credits, grants, and loans, seek to position the United States as the global leader in next-generation energy technologies such as advanced renewables, hydrogen, carbon capture and storage, advanced nuclear, and enhanced geothermal. Many clean energy related investments are only beginning to materialize into shovels in the ground, but in just under three years since the passage of the Inflation Reduction Act (IRA) that created or expanded these energy tax incentives, almost every community in the United States has been impacted by new investment, production, and development.
The future of clean energy tax credits, and broader U.S. energy deployment, hangs in the balance, as the 119th Congress considers rolling back federal support. Recent analysis by Brattle, Energy Innovation, and Rhodium Group find that repealing energy tax credits would have significant consequences for energy costs for both households and manufacturers, eliminate hundreds of thousands of jobs, stifle U.S. industrial competitiveness, and reduce economic growth and GDP.
CATF takes a deeper look into the geography of federal clean energy tax credits to provide a snapshot of where and how these credits are shaping local economies across the United States.
The analysis below indicates that such rollbacks would have disproportionate effects on specific regions of the country, with outsized impacts in Southern and Western states; Republican districts; and historic manufacturing and industrial communities that have been reinvigorated by these investments.
Southern and Western states benefit significantly from clean energy investments
Figure 1. Total reported investments per capita for manufacturing, utility electricity, and industrial facilities under construction or completed between Q2 2022 and Q1 2025 (post-IRA).
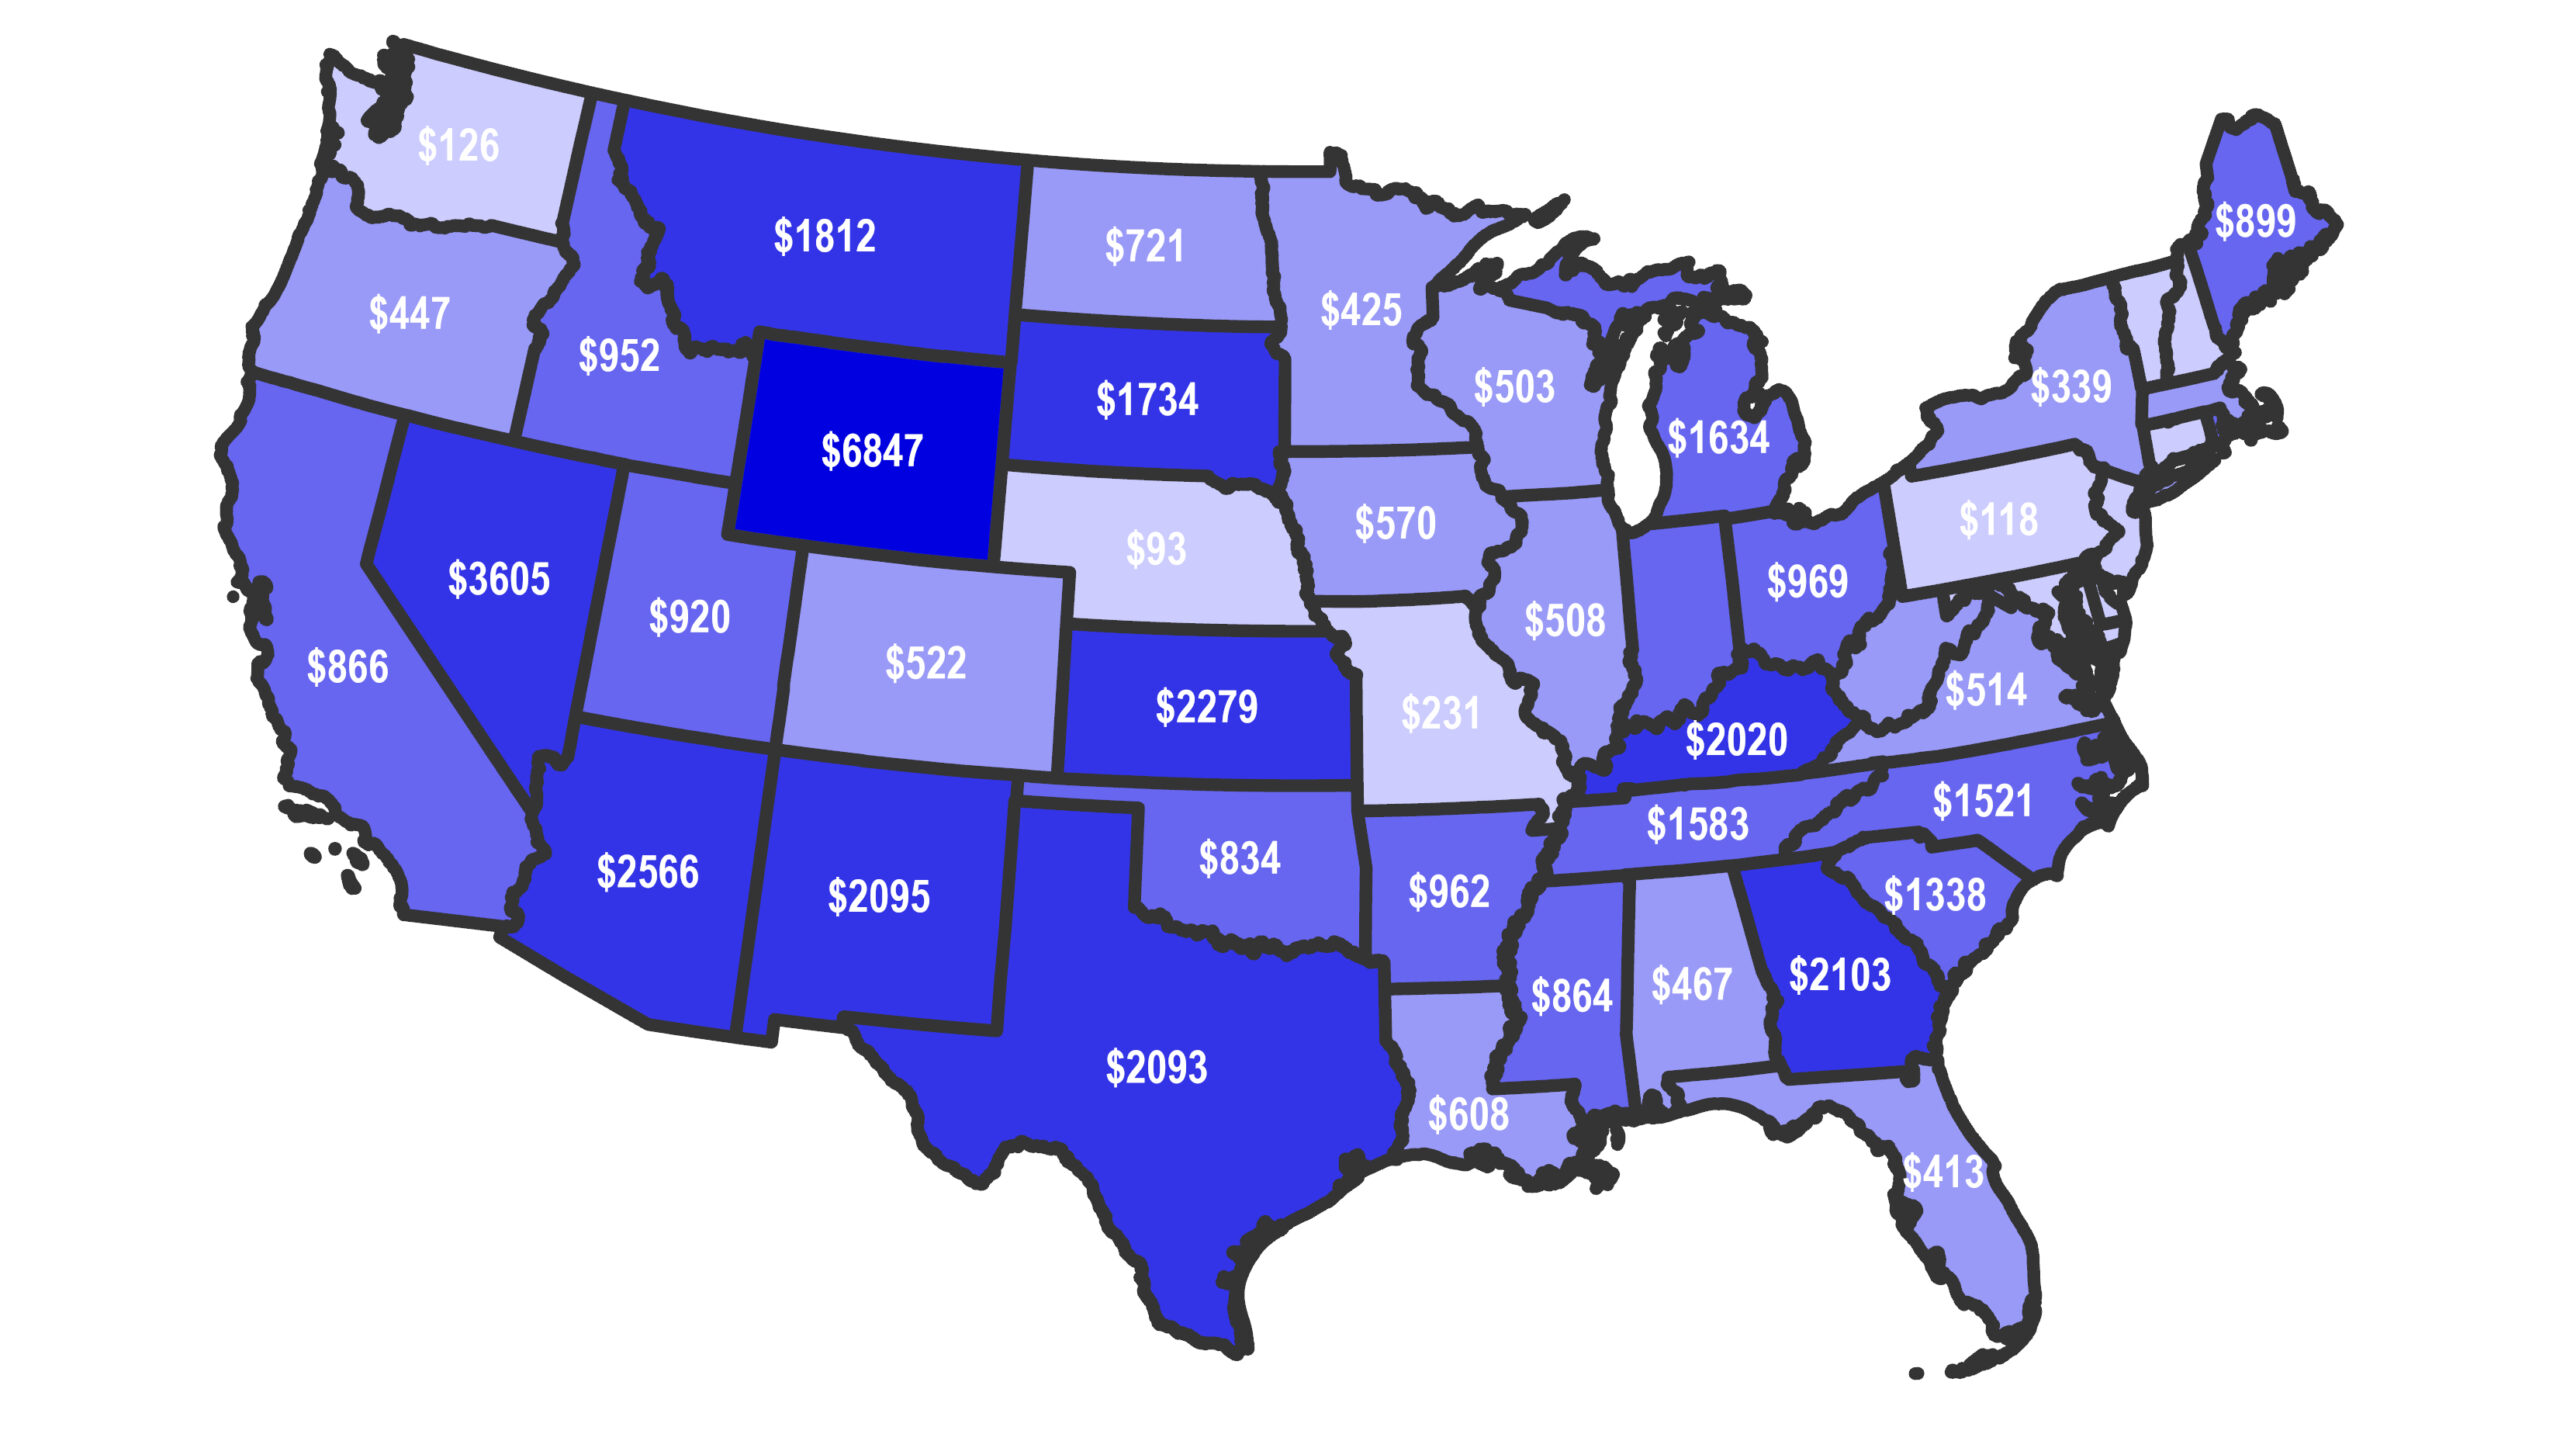
From the second half of 2022 through the first quarter of 2025:
- Over $321 billion was invested in manufacturing, electricity, and industry projects across the United States, with over 2,000 facilities breaking ground during this period.1
- In aggregate, Texas and California have seen the most clean energy related investments, totaling $62.3 billion and $34 billion, respectively, between 2022 and the first quarter of 2025.
- Texas has leveraged its diverse energy portfolio and streamlined permitting and approval processes to activate a slew of energy projects across technologies, while California has taken advantage of federal incentives to drive investments towards the state’s evolving energy system.
While Texas and California are the clear winners in the aggregate, analysis on a per capita basis2 reveal that clean energy investments have also significantly benefited other Western and Southern states:
- Nevadans on average have received $3,605 from clean energy investments
- New Mexicans have gained about $2,095 from clean energy investments
- Wyoming registers the highest per capita benefit from clean energy investments at over $6,800
For comparison, the per capita benefits in Massachusetts, New Jersey, and New York are all below $1,000.
Texas, the largest energy consuming state and largest net supplier of energy to other states, has seen over $60 billion in investments on solar, wind, batteries, storage, critical minerals, carbon capture, hydrogen, sustainable aviation fuel, and carbon removal projects across power, manufacturing, transport, and industry sectors. There are currently 130 of these projects under construction and 234 projects in operation, which are already expanding local and nationwide industry capabilities while creating and sustaining thousands of construction, manufacturing, and installation jobs across the state. This surge of investments is only fraction of what Texas should expect to see – the state still has an estimated $128.5 billion in outstanding investments for 250+ more announced projects.
Texas is one of many states with significant project investments in the pipeline. Projections show significant tax credit-induced investments are still outstanding for a number of states like Louisiana, North Dakota, Washington, Virginia, and Oregon. For example, Louisiana has seen $2.8 billion invested in the state since the second half of 2022, only 7% of the total expected project investments to come to the state. North Dakota, Washington, Virginia, and Oregon have yet to receive more than 50% of their expected investments as well.
Job creation spurred by clean energy investments are concentrated in Republican districts
Figure 2. Cumulative job potential by congressional district, including construction and operational jobs, generated by clean energy tax credits (post-IRA).
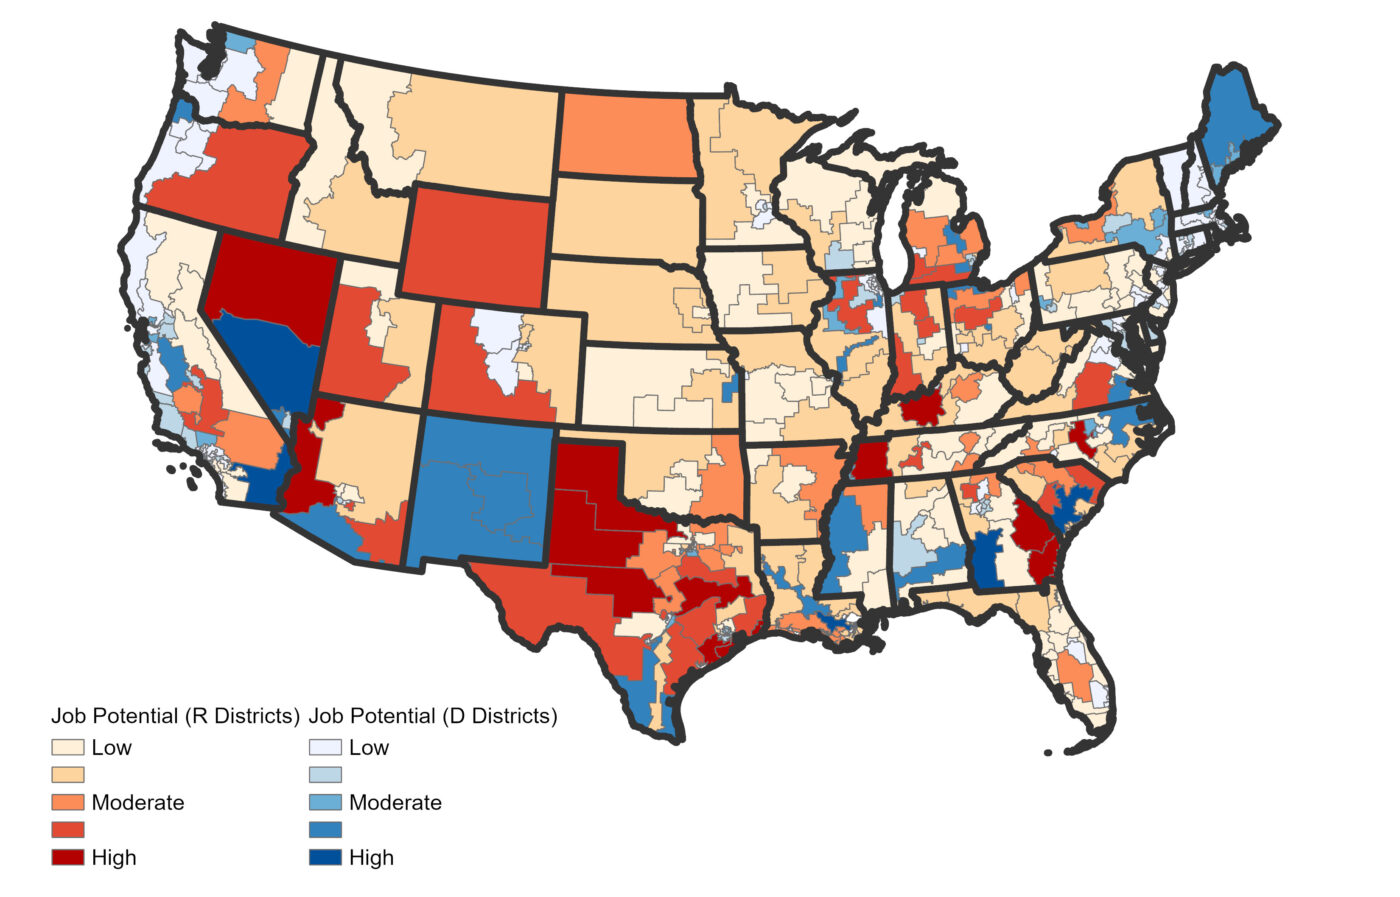
As firms take advantage of federal incentives to expand existing facilities, initiate greenfield projects, or invest in new production capacity and supply chains, communities are seeing broader opportunities for jobs in the energy sector. The map above shows cumulative job potential by congressional district, including construction and operational jobs, based on announced or completed projects that have been supported by clean energy incentives.
As others have noted, most clean energy projects are landing in Republican-held districts and they stand to lose the most if these incentives are rolled back. In fact, CATF finds that, on average, for every job generated in a Democratic district, three jobs are generated in a Republican district.
Moreover, nine of the top ten districts expected to gain the most jobs are currently held by Republicans:
- This includes Nevada’s second congressional district (NV-02), where major investments include Lithium America’s Thacker Pass mine, which is expected to produce enough battery-quality lithium carbonate per year to power 800,000 electric vehicles. The project recently reached a key development milestone and could provide almost 2,000 jobs from an agreement between Bechtel and North America’s Building Trades Unions to establish a local apprenticeship program.
- Other districts at risk of unrealized job gains include Texas’ nineteenth congressional district (TX-19), Arizona’s ninth congressional district (AZ-09), and Tennessee’s eighth congressional district (TN-08), where cumulative job impacts from clean energy investments are expected to be over 10,000 each.
These districts, along with many others across the country, are benefiting from tangible growth and economic gains associated with new projects, from increased local tax revenue to thousands of new construction, manufacturing, and operations jobs.
Historic manufacturing and industrial corridors are benefiting alongside emerging clusters
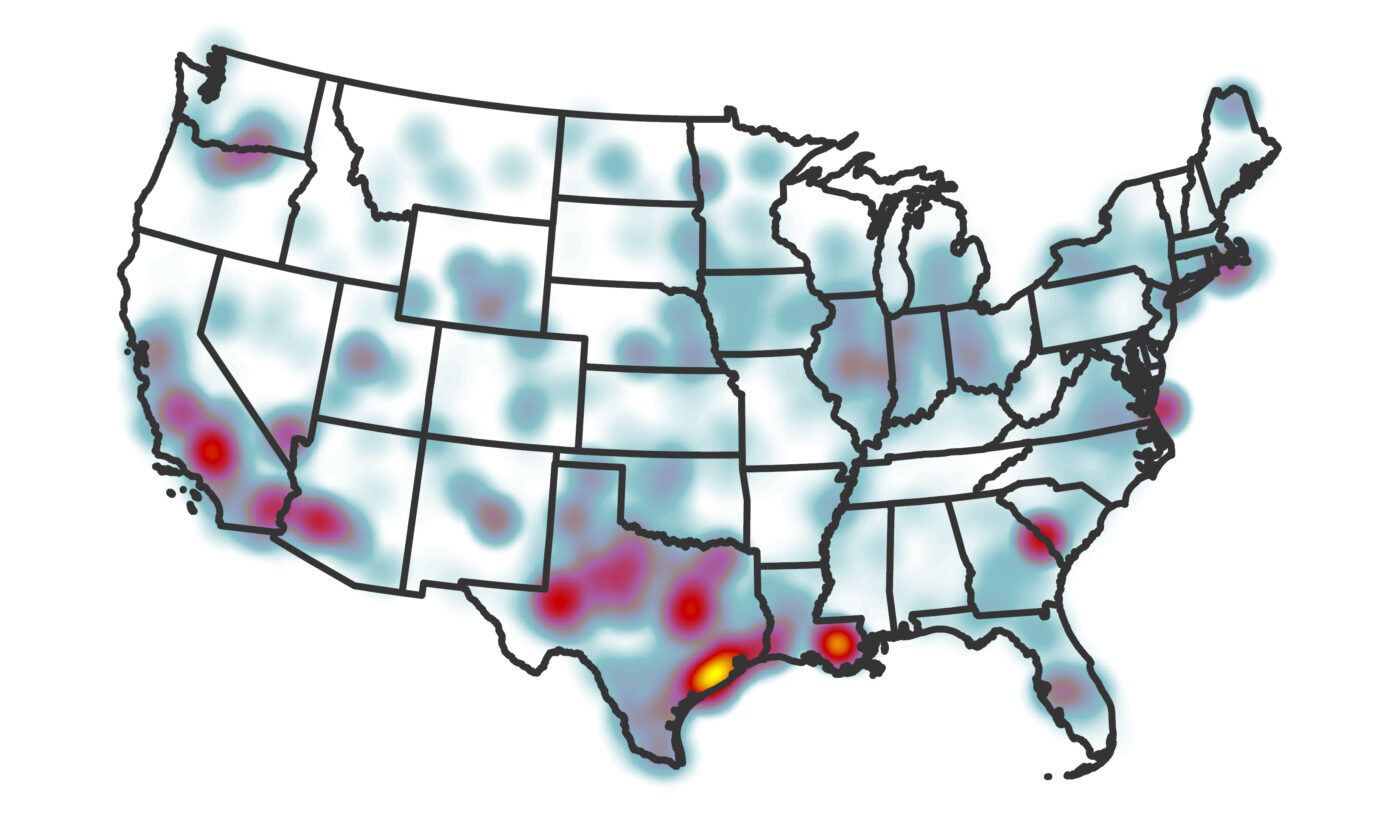
Figure 3. Density heat map of facility-level investments across the U.S., weighted by size of capital expenditures, from Q2 2022-Q12025 (post-IRA).
Energy and Industry
Manufacturing
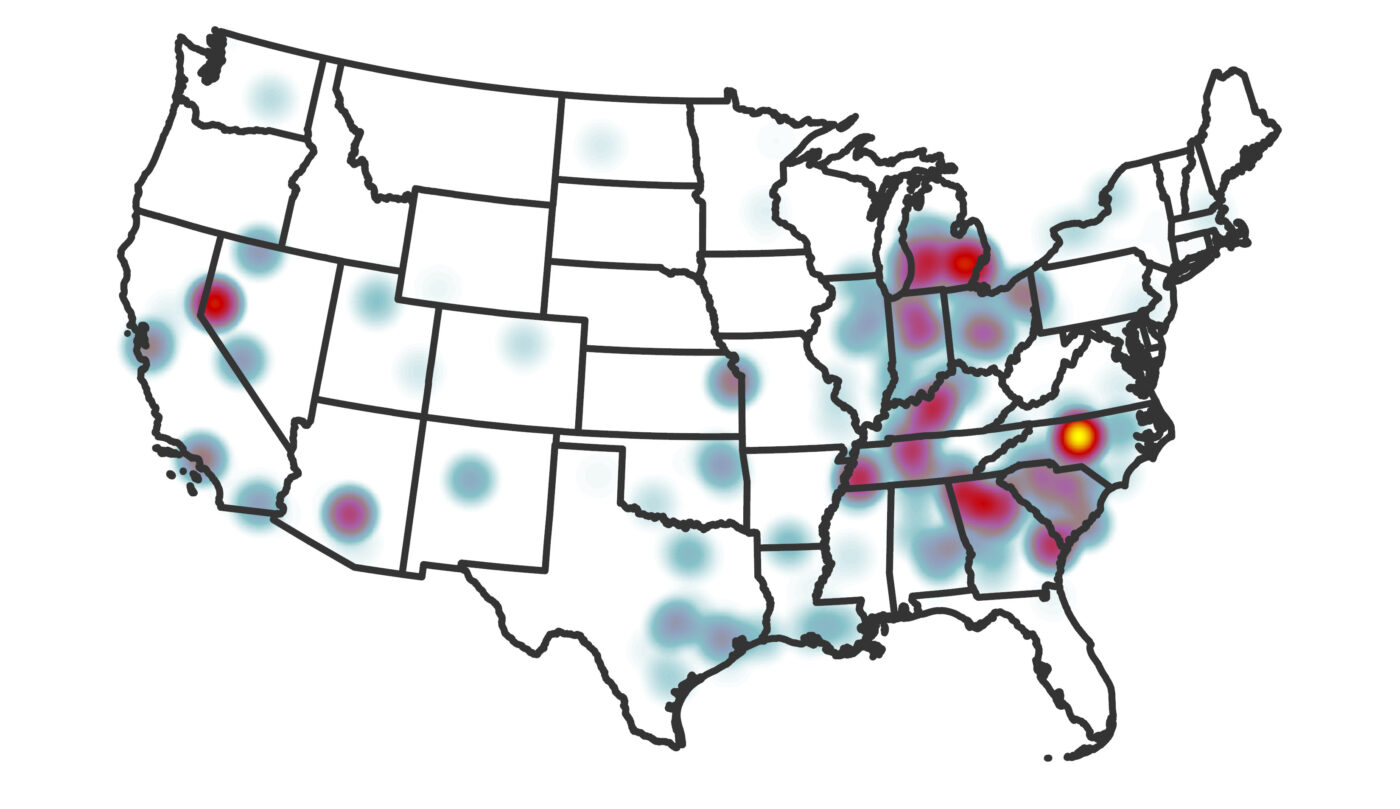
Lastly, there appears to be an emerging geographic pattern in the type of clean energy projects that are flowing into communities, supporting existing industrial, manufacturing, and energy corridors as well as catalyzing new hubs. The heat maps above show the regional concentration of facility-level investments as of the first quarter of 2025, weighted by the size of investments. This allows for assessing the spatial concentration of actual investment dollars.
CATF finds significant energy and industry-related investments in the Gulf Coast, Southern Louisiana, the Texas Triangle, and established corridors for energy-related sectors. Energy and industry-related investments are also flowing into emerging hubs such as Southern Arizona, which has drawn investments in solar, batteries, critical minerals and hydrogen. Major investments include America Battery Factory’s $1.2 billion production facility in Tuscon and Fortescue’s $550 million green hydrogen project in Buckeye, which is now at risk as the future hydrogen incentives remain uncertain.
Manufacturing investments, meanwhile, have concentrated in the Midwest and emerging manufacturing clusters in the Southeast, notably Northern Georgia and North Carolina. For example, Toyota’s nearly $14 billion investment in EV production in Liberty, North Carolina is among the largest clean energy investments in the country, and the facility is expected to continue to ramp up production capacity through 2030.
Clean energy manufacturing has evolved from a niche subsegment to a powerhouse industry and is forecast to contribute $86 billion to the country’s GDP by 2030. Curtailing federal support for crucial incentives would jeopardize much of this progress.
These projects depend on sustained federal incentives, including grants and tax credits. But there is still a large percentage of investment outstanding, putting these projects – and the economic and public health benefits they create – at risk if clean energy provisions are diminished or eliminated.
1 Rhodium Group and MIT Center for Energy and Environmental Policy Research, 2025
2 The total investment in each state, divided by state population

