
Mapping opportunities to decarbonize the U.S. pulp and paper industry

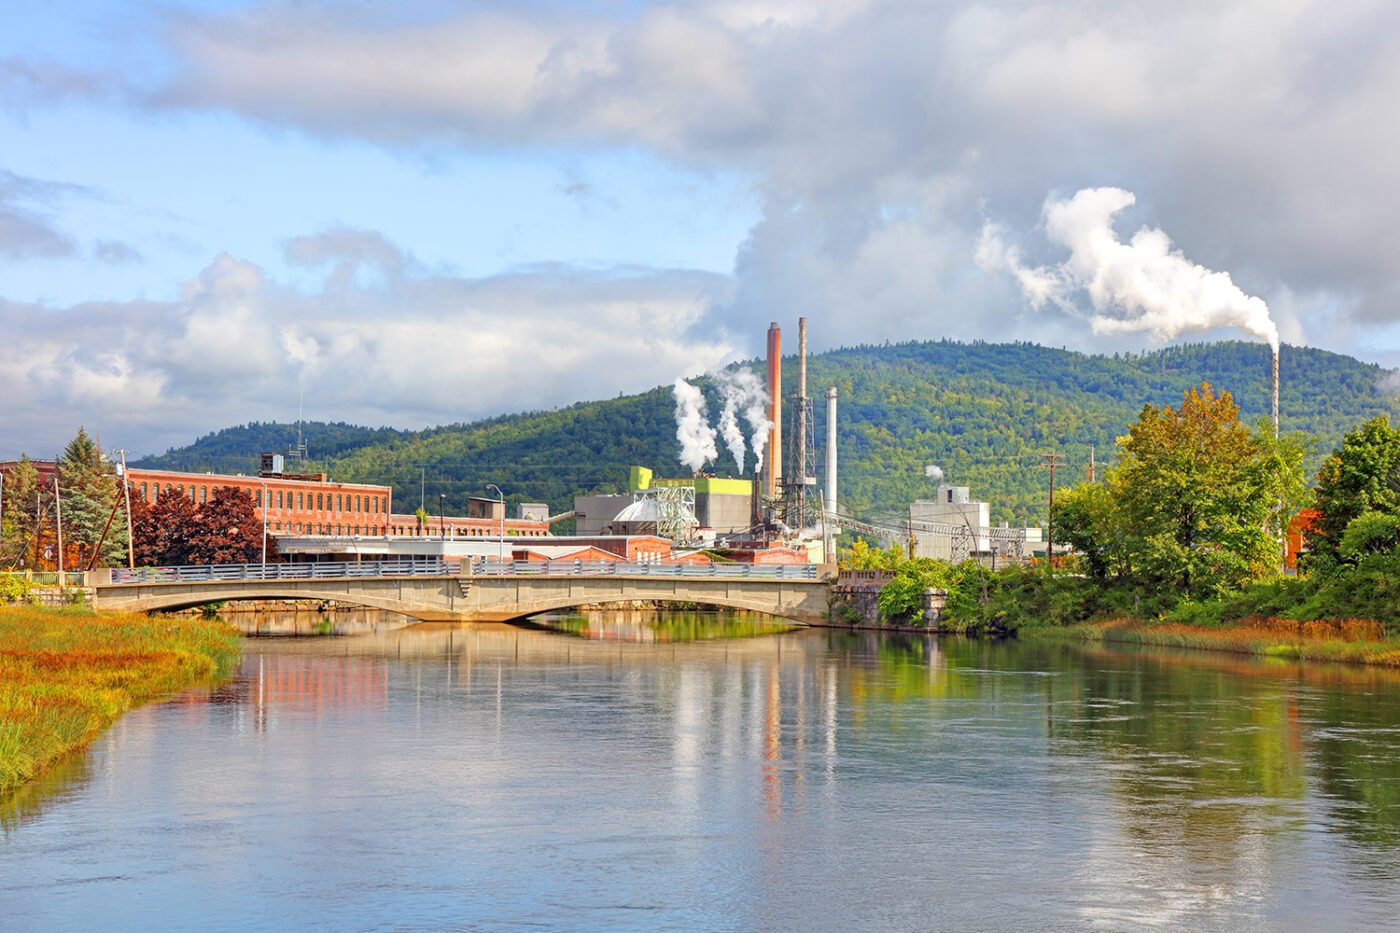
The U.S. pulp and paper industry accounts for 9 percent of total industrial energy consumption and 2.5 percent of domestic industrial greenhouse gas emissions.1 While often overlooked in broader industrial decarbonization strategies, the sector holds significant potential for deep emissions reductions. Many facilities already rely on waste biomass generated from forest biomass processing to produce energy, meaning application of carbon capture and storage (CCS) could deliver net-negative CO2 emissions. To further explore the possibilities for decarbonizing the pulp and paper industry, Clean Air Task Force developed an exploratory mapping tool to identify where CCS and carbon removal opportunities could be pursued most effectively within this sector.
Recent signals point to growing momentum for CCS in the pulp and paper sector. In April 2025, Microsoft and carbon dioxide removal developer CO280 announced one of the largest carbon removal purchases to date: 3.7 million metric tons from a Gulf Coast pulp and paper mill. Months following this announcement, CO280 indicated that their field pilot successfully achieved a consistent capture rate of 95% over 4000 hours of operation. The U.S. Department of Energy has identified the sector as a priority in its Carbon Management Strategy, highlighting the opportunity to reduce capture costs by pairing CO2 capture with novel electrification of the calcination process, which would eliminate combustion emissions and produce a stream of CO2 with a higher concentration, thereby eliminating the need for energy intensive CO2 removal from flue gas.
Targeting high-impact facilities
This map-based, interactive tool evaluates every U.S. pulp and paper facility on five key factors:
- Cost of capture – Estimated expense of financing, installing, and operating CCS for a given plant. High-scoring facilities are those for which unit costs are estimated to be at or below $85/ton of CO2 permanently stored (the current level of the 45Q production tax credit).
- Capture potential – Volume of fossil and biogenic CO₂ that could be captured. Greater volumes (above 1,000,000 MT) score higher to reflect higher capture potential.
- Storage cost – Cost of transporting and storing CO₂, considering proximity to geologic storage. Lower transport and storage costs (below $16/ton) score high to reflect greater CCS feasibility.
- Infrastructure clustering – Opportunities to share CO₂ transport and storage infrastructure with nearby industrial emitters. We apply spatial statistics to measure proximity of these mills to other industrial emitters that may share CCS infrastructure; the greater the proximity, the higher the score.
- Environmental and economic co-benefits – Potential for job creation, economic development, and air quality improvements.2 We use county-level indices, including those from the Livermore Lab Foundation’s Roads to Removal report, that evaluate the co-benefit potential of carbon removal pathways. Higher scores reflect higher co-benefit potential.
Facilities are scored on each factor to identify the highest-opportunity locations for cost-effective deployment with strong emissions reduction and community benefits. The lowest possible score across the five metrics is 2 and the highest is 15.

The Gulf Coast stands out, but key barriers remain
The mapping analysis points to a clear geographic advantage for certain regions. Facilities in the Gulf Coast, particularly in Texas, Louisiana, Mississippi, and Arkansas, stand out for their significant potential to pursue decarbonization opportunities. Pulp and paper facilities in these states benefit from lower storage costs, greater proximity to suitable geologic formations, and opportunities to connect with existing or planned CO₂ infrastructure serving other industrial emitters. Potential co-benefits, such as job creation, economic development, and environmental improvements are also high among Southern and Southeastern mills. County-level assessments indicate these facilities are located in areas where geologic storage or woody biomass carbon removal and storage removal projects could result in significant economic and environmental benefits to host communities.
Louisiana’s seven pulp and paper facilities score high in the opportunity index, averaging over 13 points (maximum score is 15 points).

| State | Number of Facilities | Composite Opportunity Score |
|---|---|---|
| Alabama | 11 | Moderate–High |
| Arkansas | 5 | Moderate-High |
| Florida | 5 | Moderate-Low |
| Georgia | 11 | Moderate-High |
| Idaho | 1 | Moderate-Low |
| Kentucky | 2 | Moderate-Low |
| Louisiana | 7 | High |
| Maine | 5 | Low |
| Michigan | 3 | Moderate-Low |
| Minnesota | 2 | Moderate-Low |
| Mississippi | 4 | High |
| North Carolina | 5 | Moderate-Low |
| New York | 2 | Low |
| Ohio | 1 | Moderate-High |
| Oklahoma | 1 | Moderate-Low |
| Oregon | 4 | Moderate-Low |
| Pennsylvania | 2 | Moderate-Low |
| South Carolina | 6 | Moderate-Low |
| Tennessee | 1 | Moderate-Low |
| Texas | 3 | High |
| Virginia | 6 | Moderate-Low |
| Washington | 6 | Low |
| Wisconsin | 5 | Low |
Additional insights include:
- Pulp and paper mills have the potential to be high-value carbon removal assets because of their biomass-based energy use.
- Growing private sector interest in CCS and advances in capture technology are opening new opportunities, but the current federal 45Q tax credit designed to incentivize CO2 sequestration needs enhancement to drive investments at most facilities, and infrastructure gaps remain a barrier.
- De-risking and greater regulatory certainty for CO2 transport and storage infrastructure will be critical to realizing the sector’s potential for decarbonization, and in many cases these infrastructure networks cross multiple jurisdictions and states.
- High-potential states in the South and Southeast, and other states that have multiple mills, can consider developing targeted policies to promote technology innovation and emission reductions at pulp and paper facilities, such as grant programs and other incentives. These policies should be part of a broader economic development strategy linked to industrial decarbonization, which will play a key role in long-term competitiveness given European trade measures related to emissions intensity of imported products.
- The pulp and paper industry shows promise in delivering and scaling carbon dioxide removal (CDR) offtakes, which can help accelerate U.S. leadership in CDR markets.
CATF’s mapping tool provides the first nationwide look at where targeted action can drive the most impact. We welcome feedback and engagement with pulp and paper operators and companies that are evaluating opportunities to pursue CCS and other carbon management strategies.
1 Excludes biogenic emissions which contributed an addition 100.1 Mt CO2 in 2021, EPA 2011-2021 Greenhouse Gas Reporting Program Sector Profile: Pulp and Paper
2 Roads to Removal: Options for carbon dioxide removal in the United States. Chapter 9, pg. 6. 2023.

